
A whippy day in the indexes so far as the stock market becomes increasingly focused on economic data. The major indexes were working on backfilling today’s gaps when they were suddenly smacked back down immediately following the release of the ISM Manufacturing Index Report at 10:00 am, which was weaker than expected. Highlights from Econoday below: (a link to the economic calender is located in the RSOTC Support Center under ‘Tools Of The Trade’, accessible by clicking Resources on the top menu of the site)
ISM manufacturing is among the most closely followed reports on the economic calendar and August’s unexpected drop below 50 to 49.1 may very well make a rate cut at the September 17 and 18 FOMC a certainty. And given the broad weakness throughout the report, an upsized 50 basis point cut may well be in play.
New orders fell well below 50, down 3.6 points at 47.2, with new export orders down nearly 5 points at a sobering 43.3. Total backlog orders did improve but are still well into contraction at 47.4. The word improving doesn’t really fit with the August report through supplier deliveries also improved though improvement here, that is better delivery times, reflects weakened levels of demand. Employment fell 4.3 points to 47.4 with production down 1.3 points at 49.5.
Prices paid round out August’s report, below 50 at 46.0 to confirm that demand is low and also pointing to disinflationary pressures for consumer prices in what is another strong argument for lower rates. The ISM is only one sample but it does confirm, actually in dramatic sub-50 fashion, weakness in other data including this morning’s manufacturing PMI.
This report is suddenly looking like many of the global manufacturing PMIs with the mid-40 readings for many of the details evoking the recent troubles for Germany’s PMI data. With new cross-border tariffs between the US and China taking effect today, the outlook for this report next month is not promising. These numbers mark a somber inflection lower for the US manufacturing outlook.
The level of the ISM manufacturing index indicates whether manufacturing and the overall economy are growing or declining. Historically, readings of 50 percent or above are associated with an expanding manufacturing sector and healthy GDP growth overall. Readings below 50 indicate a contracting manufacturing sector but overall GDP growth is still positive until the ISM index falls below 42.5 (based on statistics through January 2011). Readings in between these two levels suggest that manufacturing is declining while GDP is still growing but only very slowly.
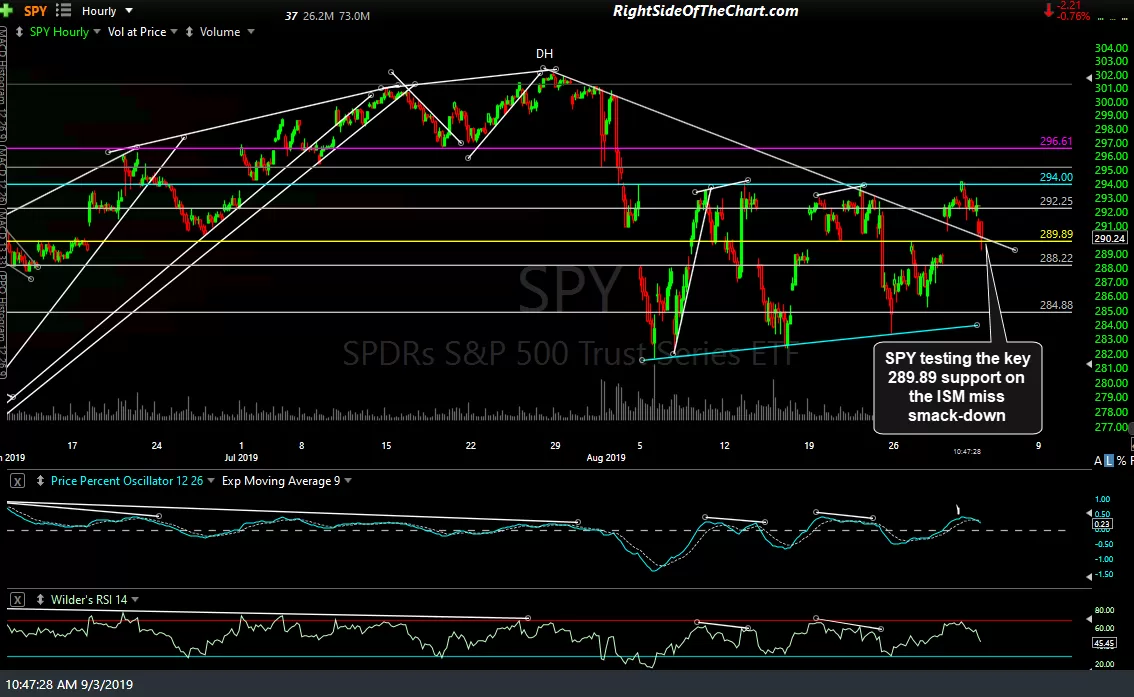
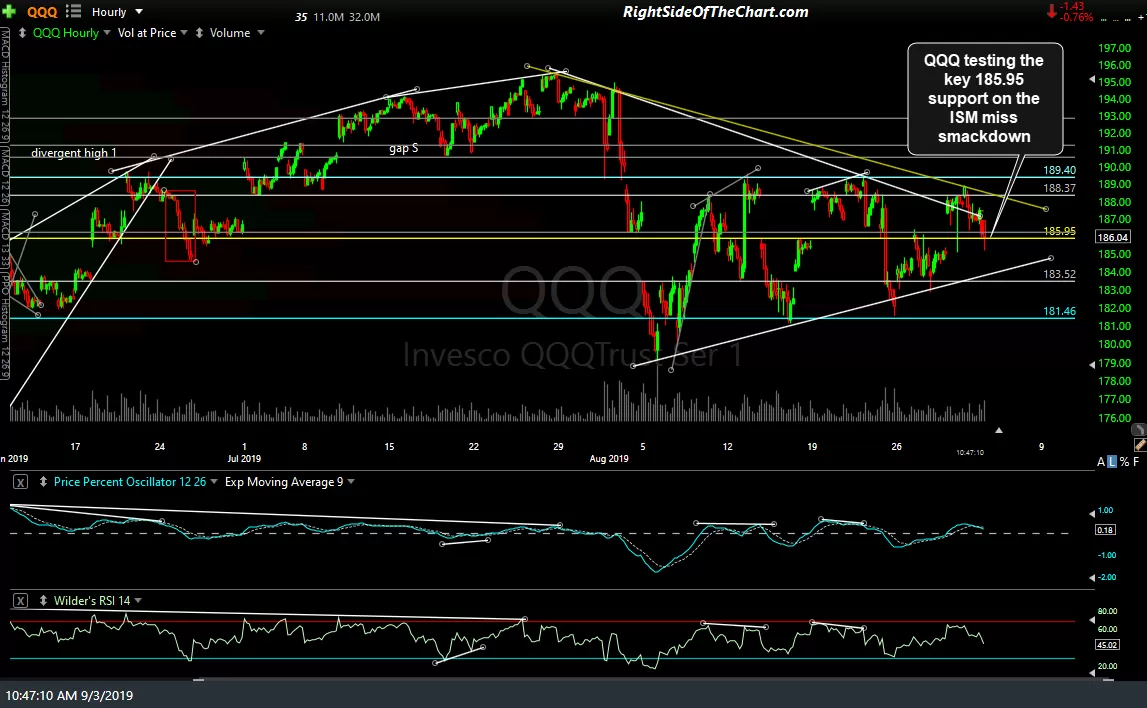
What the rest of the day will bring is the stock market trying to process if the contractionary ISM data will be bearish for the stock market, as it only confirms that the economy is slowing & may be headed into a recession -or- if that will prove bullish for stocks as it increases the chances of a 50 basis point rate cut at the next FOMC meeting vs. “only” another cut of 25 bp. As of now, SPY is testing the key 289.90ish support level as well as backtesting the downtrend line off the July highs with QQQ testing the key 185.95 support. 60-minute charts below.
-
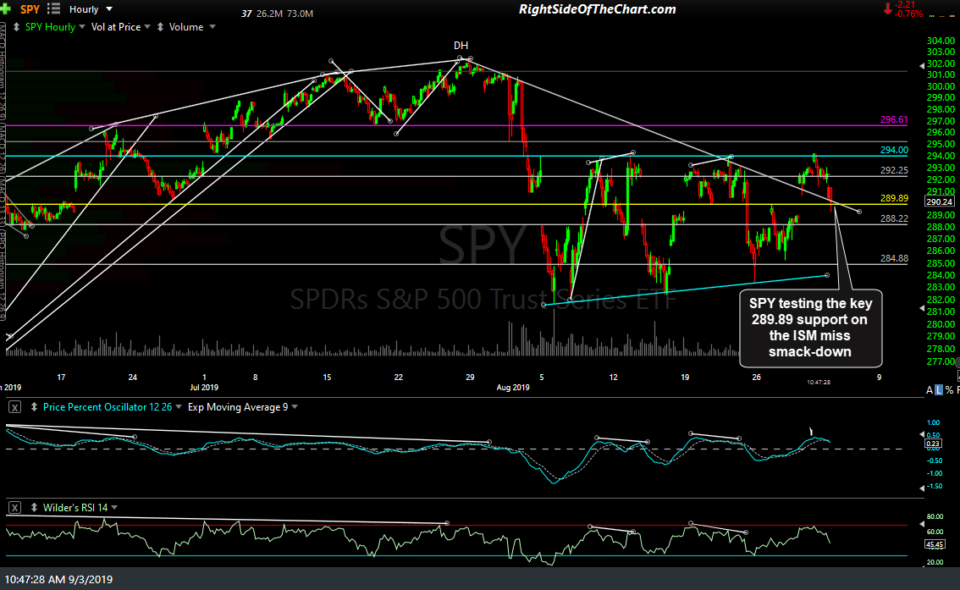
- SPY 60-min Sept 3rd
-
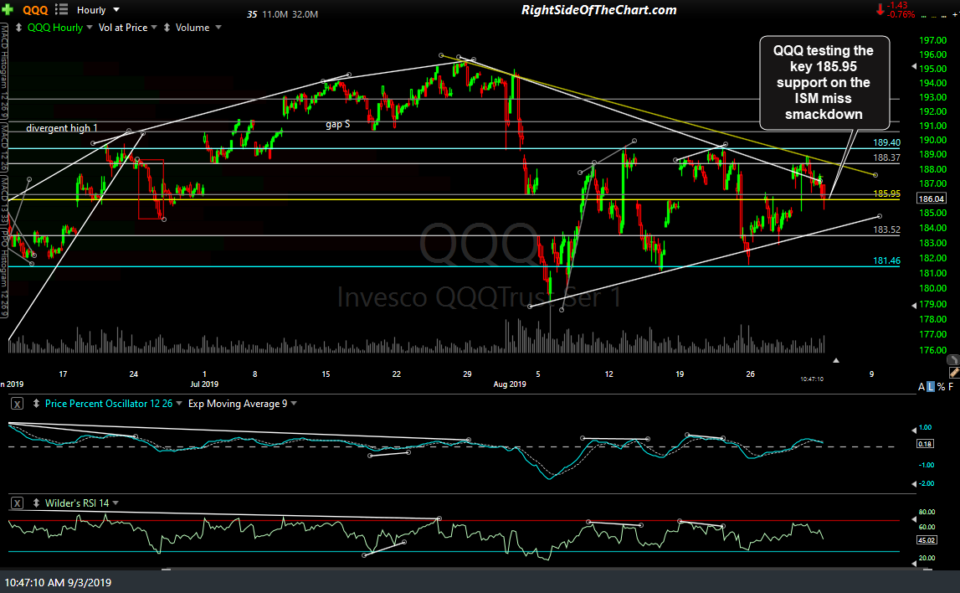
- QQQ 60-min Sept 3rd
The ISM smack-down has also taken IWM back down below the falling wedge pattern which it broke out above last week (i.e.- a failed breakout/bull trap so far), with the small caps making a backfill of last Thursday’s big gap. I still favor the bearish scenario with these support levels on SPY & QQQ giving way soon although as I like to say, support is support until & unless broken (brief momo-fueled overshoots aside). The strong rally in both gold & Treasury bonds since the ISM miss also tell us that institutional & retail traders continue to flock to those flight-to-safety assets, which certainly doesn’t help support the bullish argument for equities.
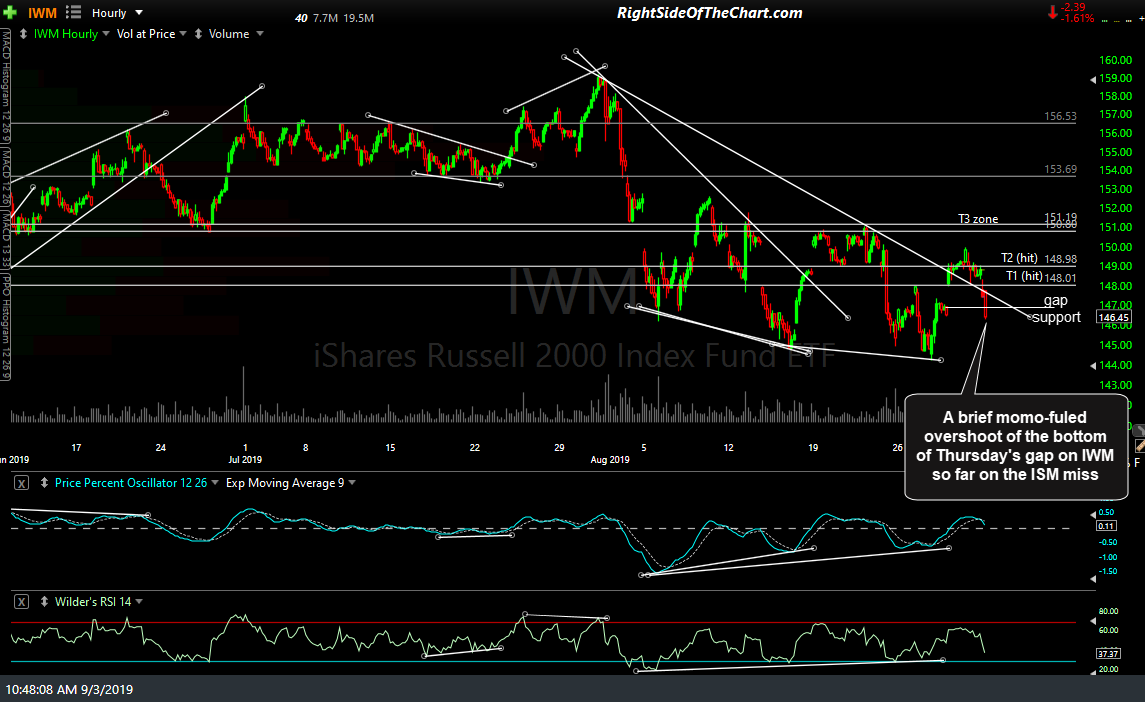
IWM 60-min Sept 3rd