
/GC (gold futures) made an impulsive breakout above both the downtrend line as well as the 1649 resistance level today with positive divergence + a double bottom on the 60-minute chart, so far. All bullish if this breakout sticks so just watching for a solid break above the triangle pattern & 0.98633 BOD resistance level highlighted on the 60-minute chart of the EUR/USD in the video earlier today.
Note: The previous 60-minute chart of /GC that was posted this morning before the wedge breakout was mistakenly sent out by email when this post was published. I have since added the updated (post-breakout) chart below the earlier 60-minute chart of /GC below.
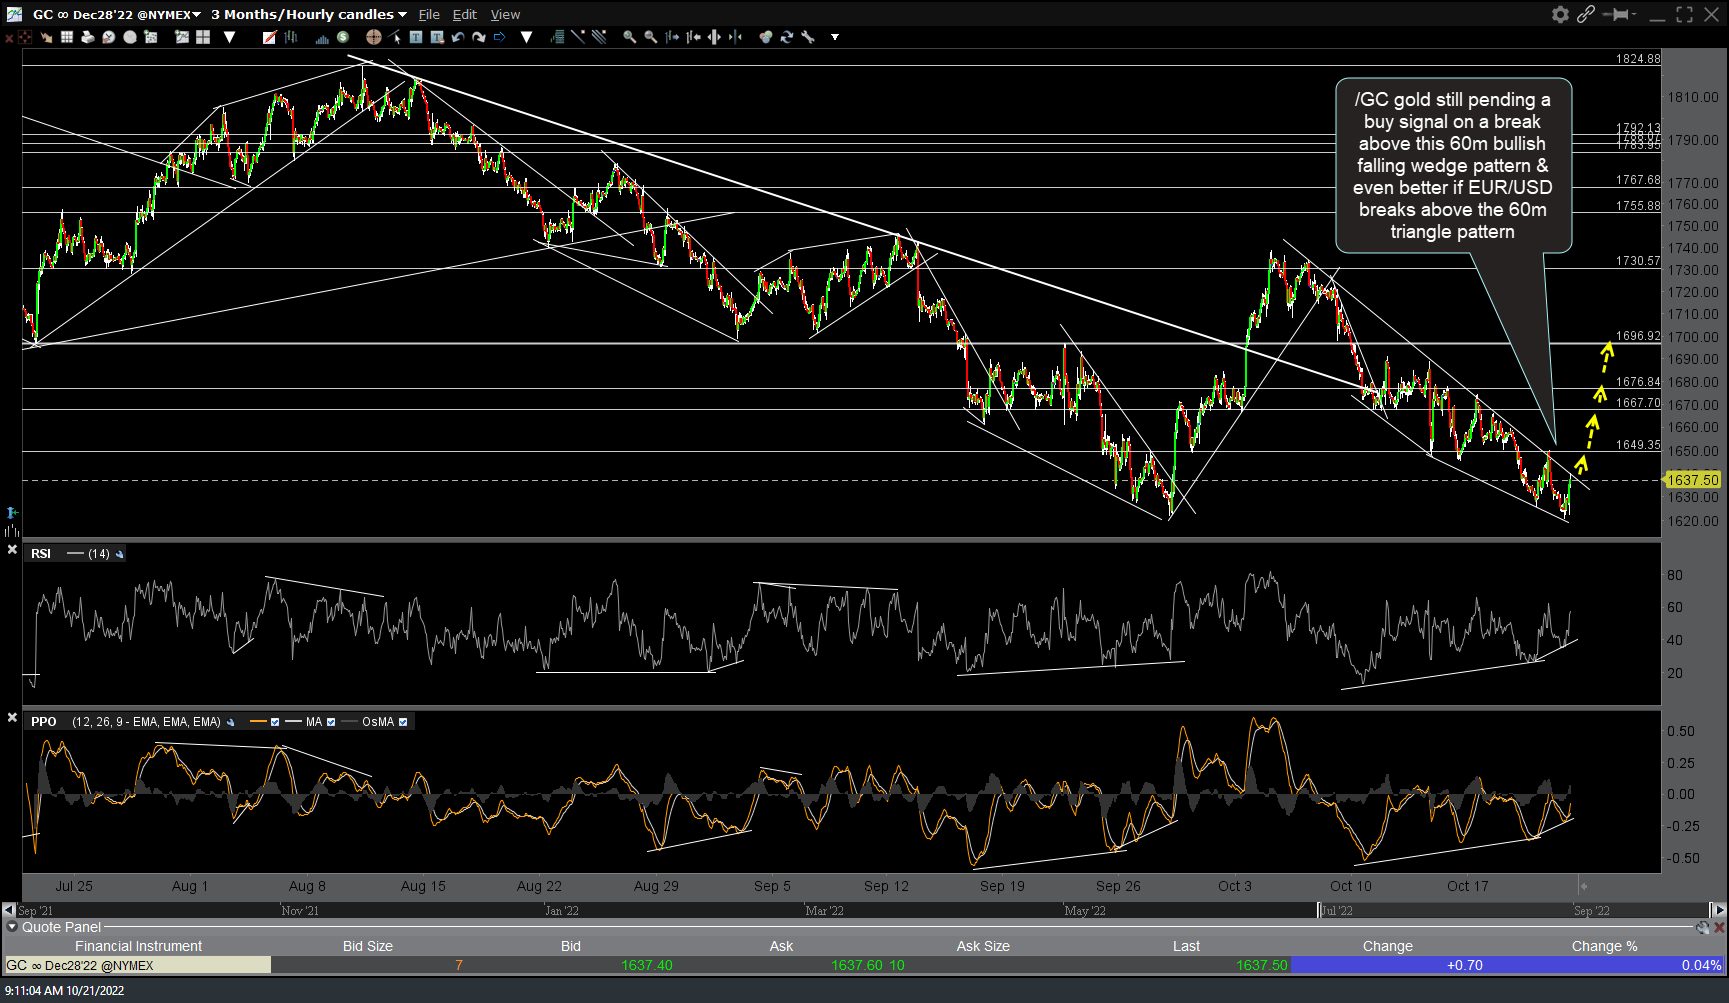
GC 60m Oct 21st
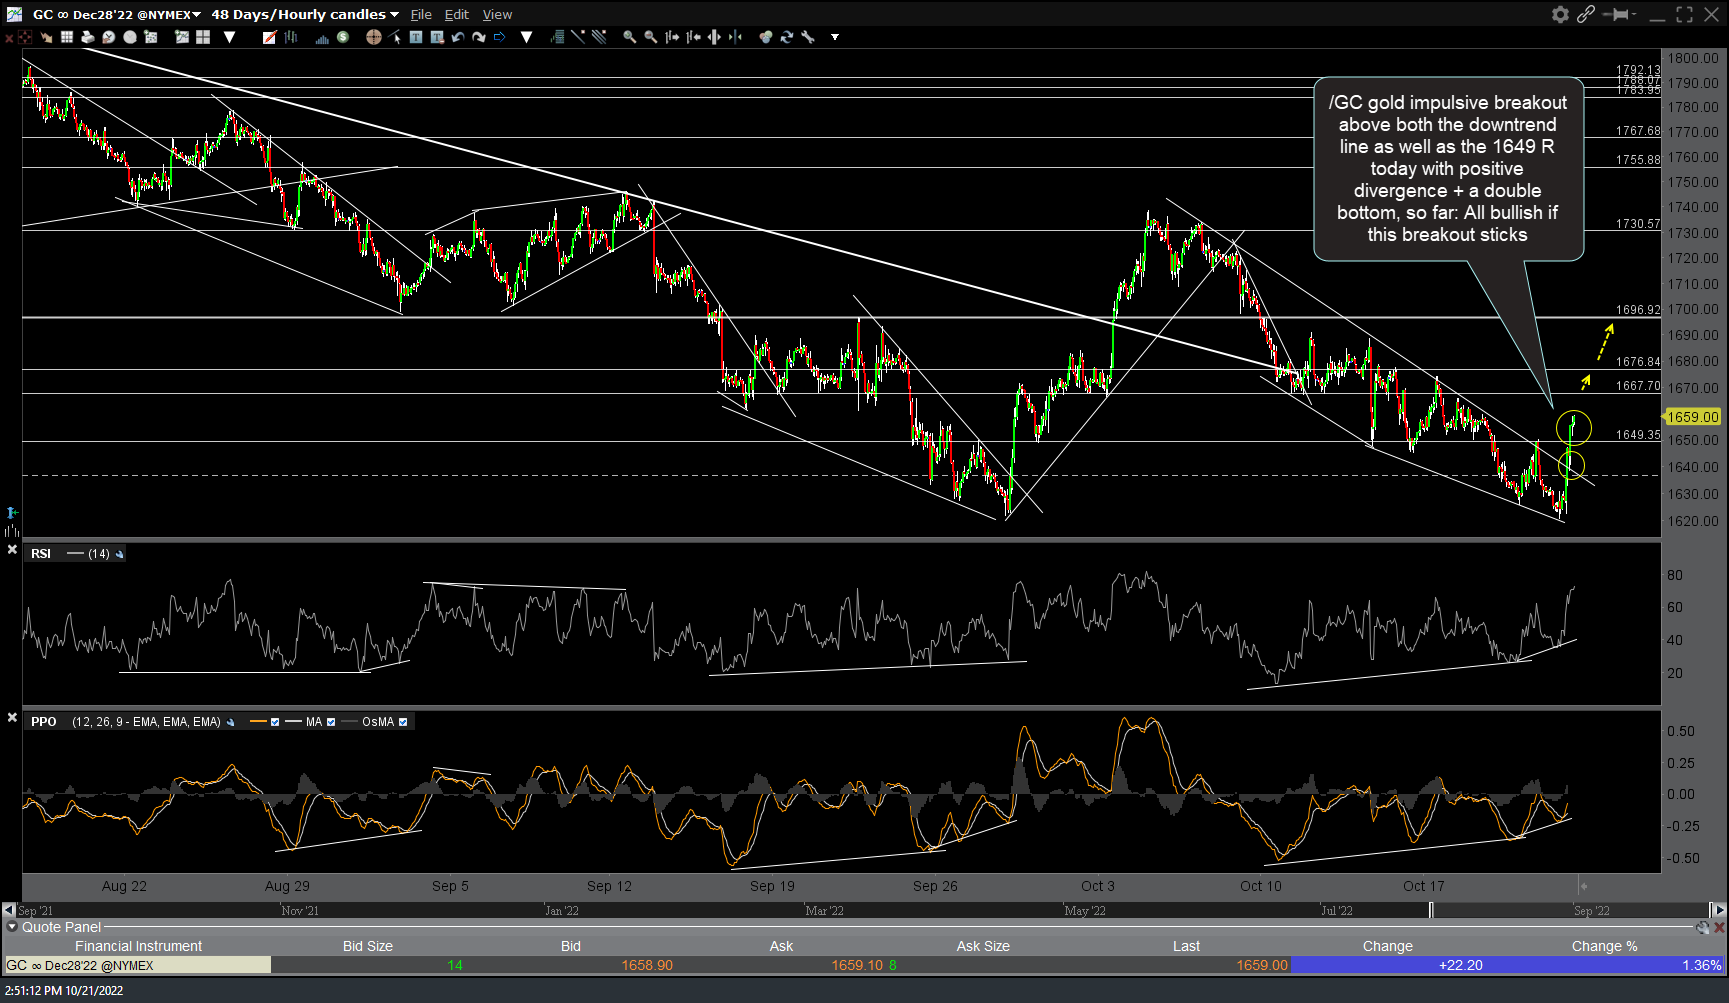
GC 60m 2 Oct 21st
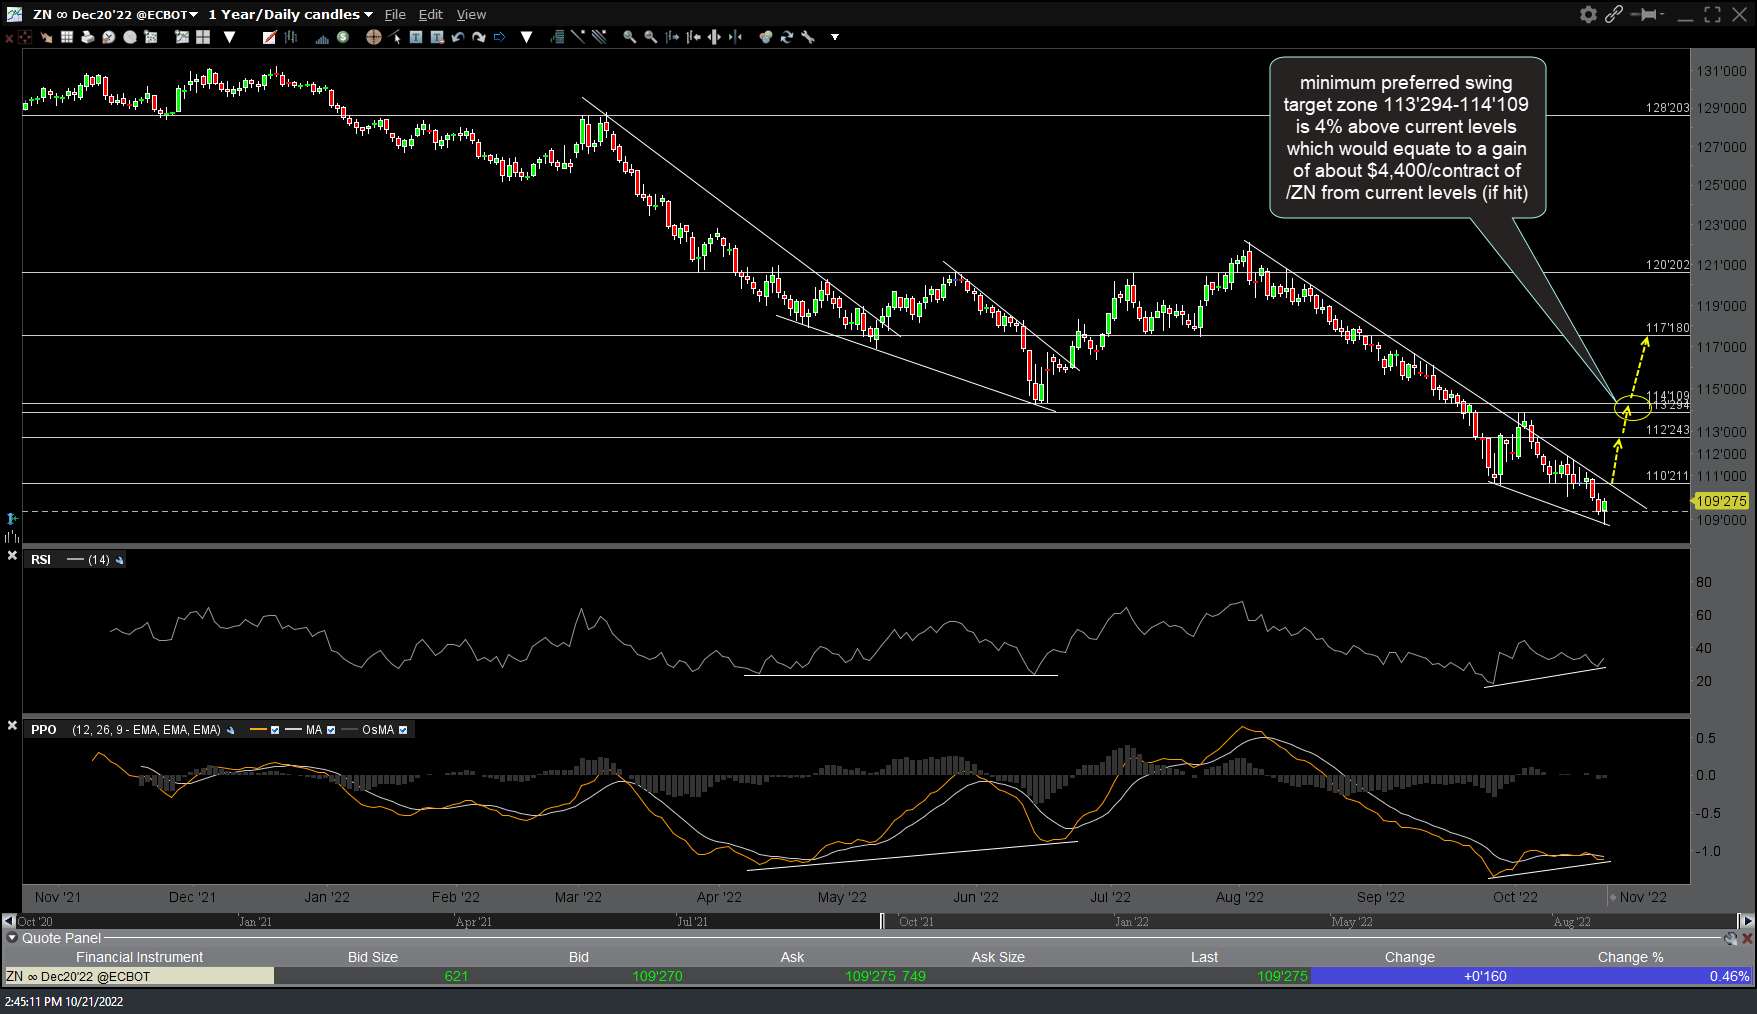
Here’s a daily chart of one of the other big (traditionally, just not so much YTD) “risk-off” assets, the 10-yr US Treasury bond, which has nice positive divergence & a well-defined downtrend line in which to trigger a buy signal or add-on for those already scaling into Treasuries due to the increasingly attractive R/R. My minimum preferred swing target zone of 113’294-114’109 is 4% above current levels which would equate to a gain of about $4,400/contract of /ZN from current levels (if hit).
ZN 60m Oct 21st
While the stock market might continue to drift into the close today if there are more nervous shorts that want to cover before the weekend than nervous long, personally I just reversed the /NQ long from earlier today back to a short position here at the 11321.50 + trendline resistance for a potential “pullback into the close” trade with negative divergences on this 5-minute time frame coupled with the rally into these intersecting resistance levels & the fact the market has been playing ping-pong for the past week or so with each half-decent rally answered by another reversal to the downside.
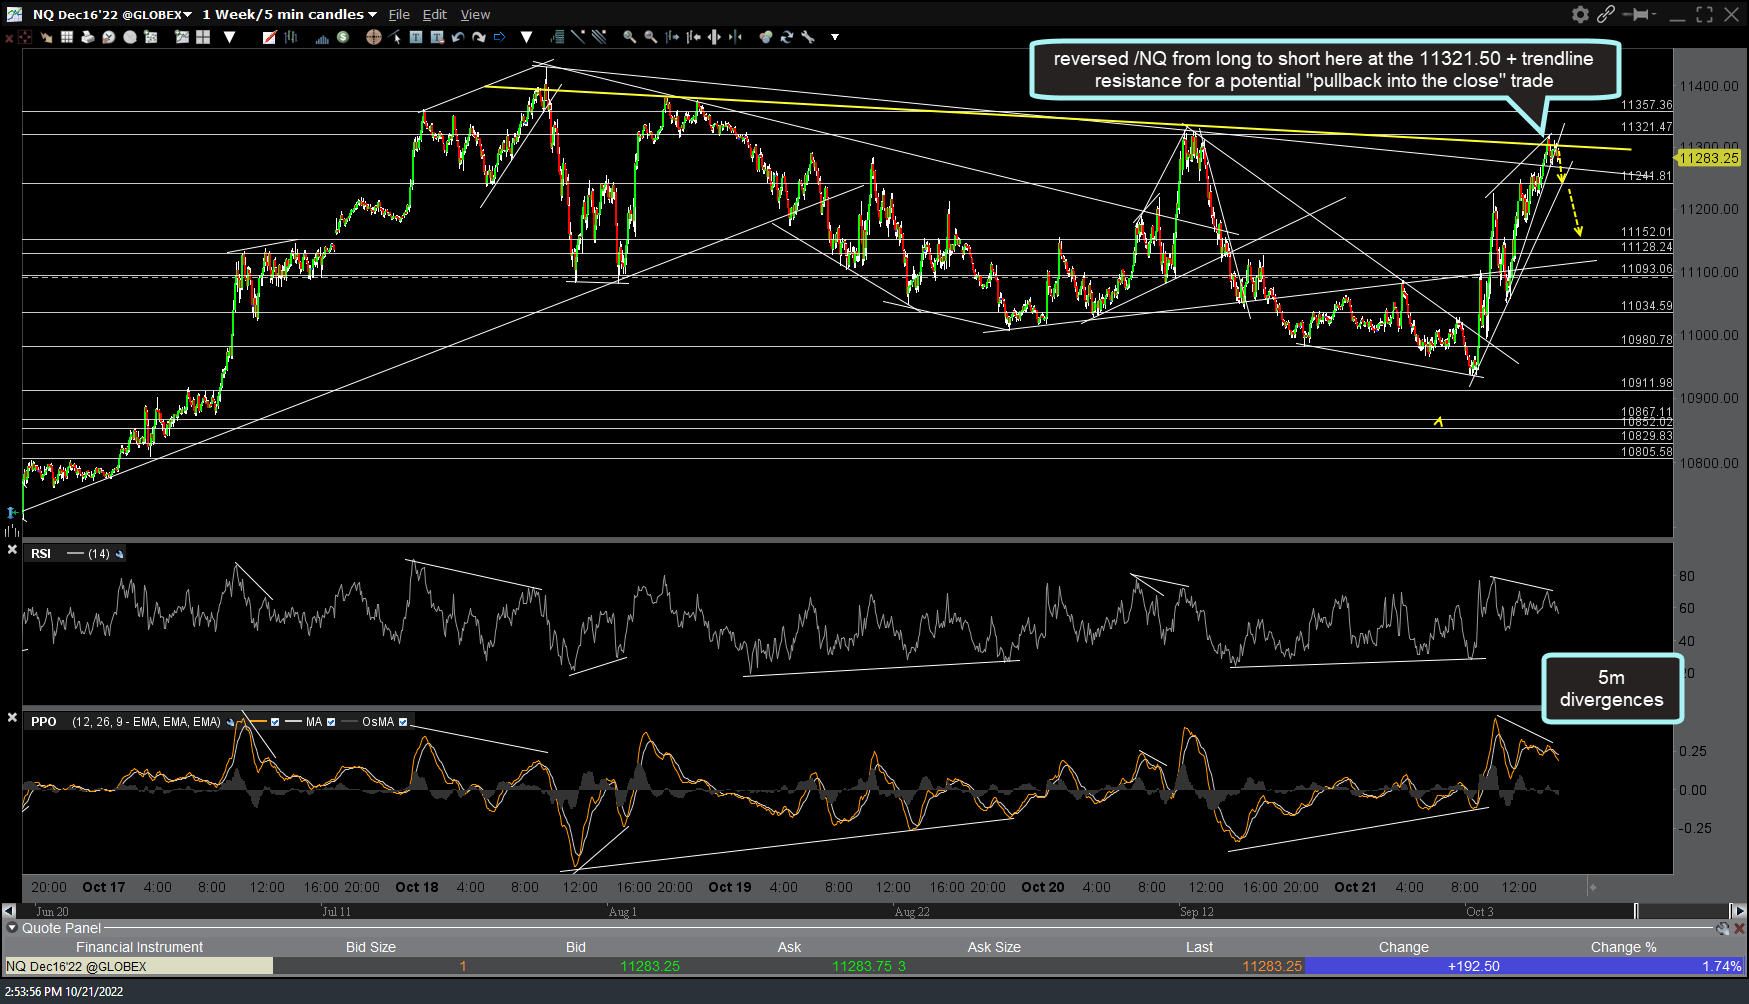
NQ 5m Oct 21st