
The INTC (Intel Corp.) active long swing trade has now cleared the T1 resistance level which opens the door for a continued rally to T2 if today’s breakout in QQQ & SPY sticks. In order to get a better gauge whether or not today’s breakout in the indexes is likely to stick, we’ll need to keep a close eye on the market-leading FAAMG stocks.
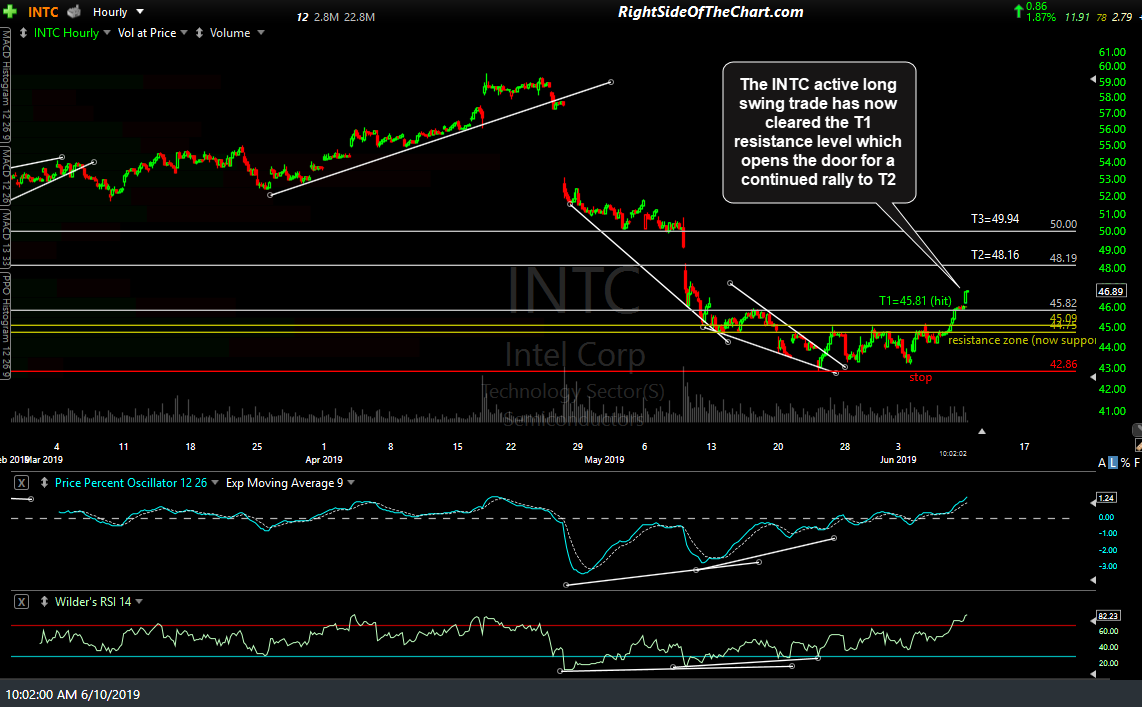
INTC 60-min June 10th
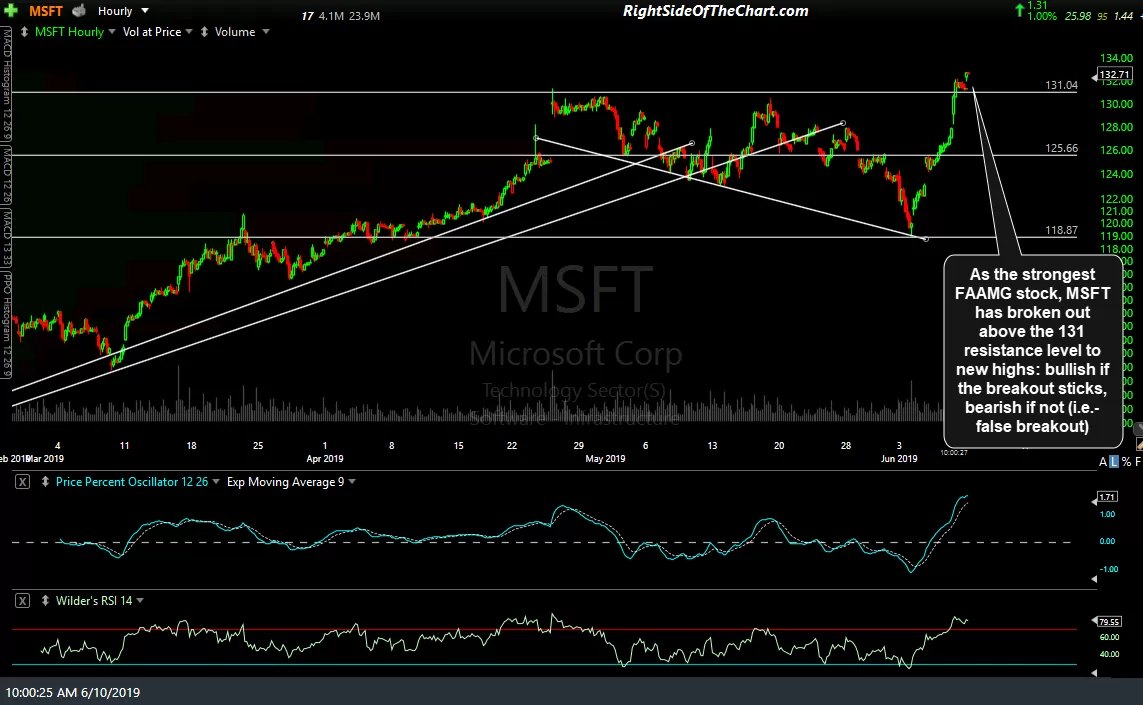
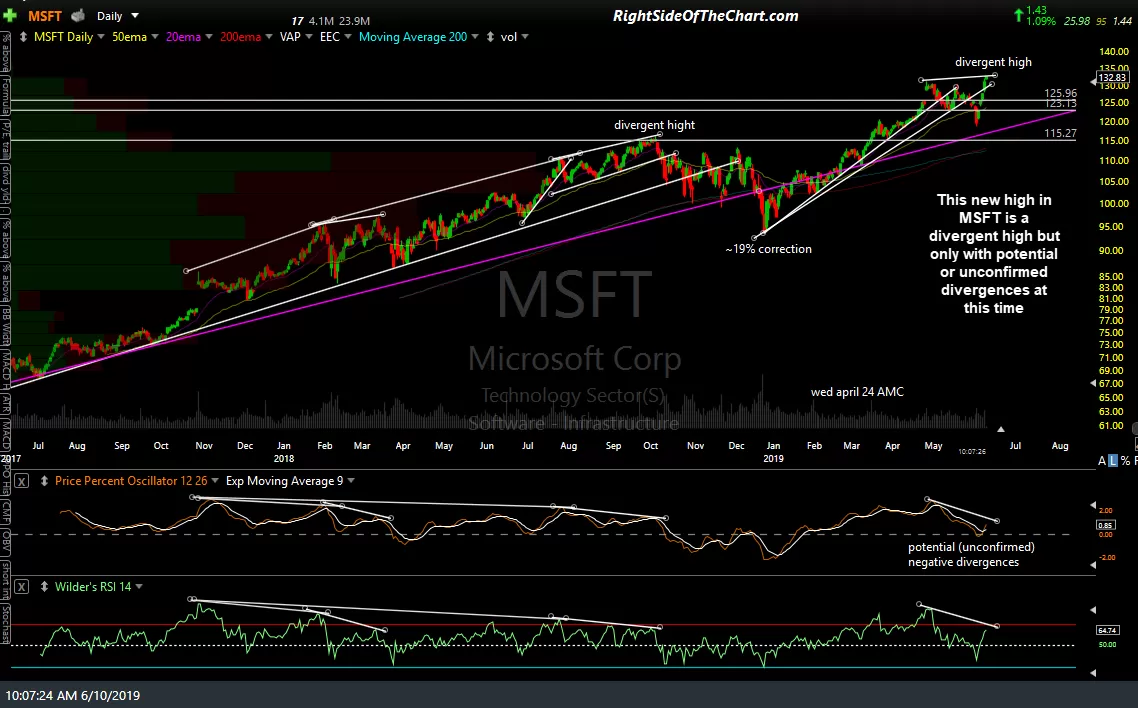
As the strongest FAAMG stock, MSFT, has broken out above the 131 resistance level to new highs: bullish if the breakout sticks, bearish if not (i.e.- false breakout). It should also be noted that this new high in MSFT is a divergent high but only with potential or unconfirmed divergences at this time. Breakouts to new highs that occur with negative divergences in place, just like the breakout in QQQ back in late April, run an increased chance of the breakout failing shortly afterward. 60-min & daily charts below.
-
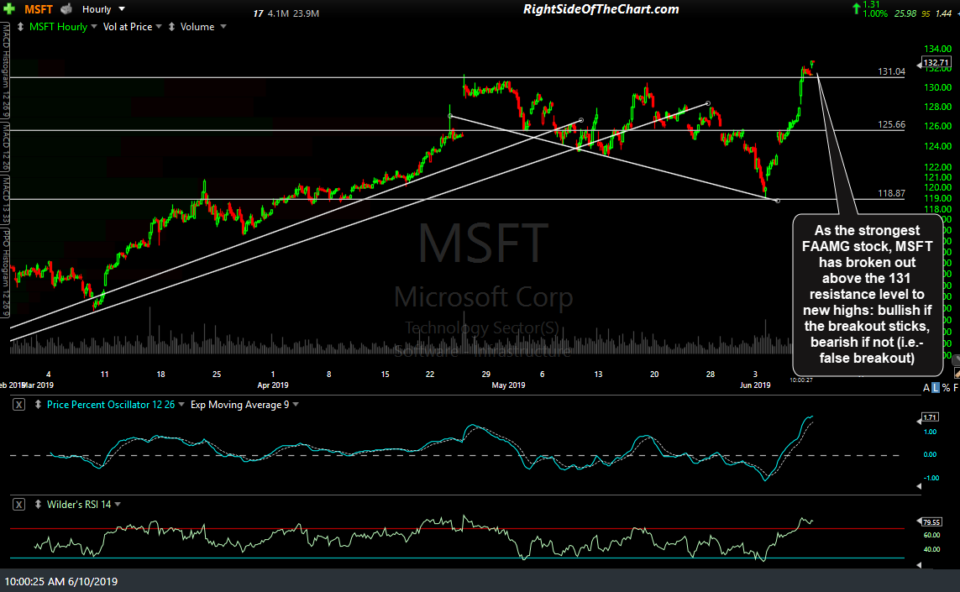
- MSFT 60-min June 10th
-
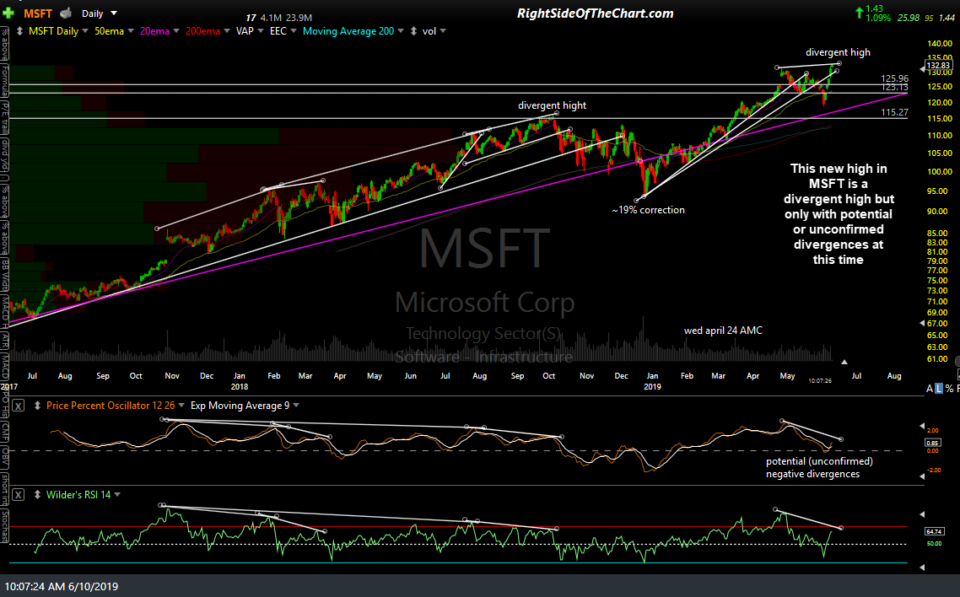
- MSFT daily June 10th
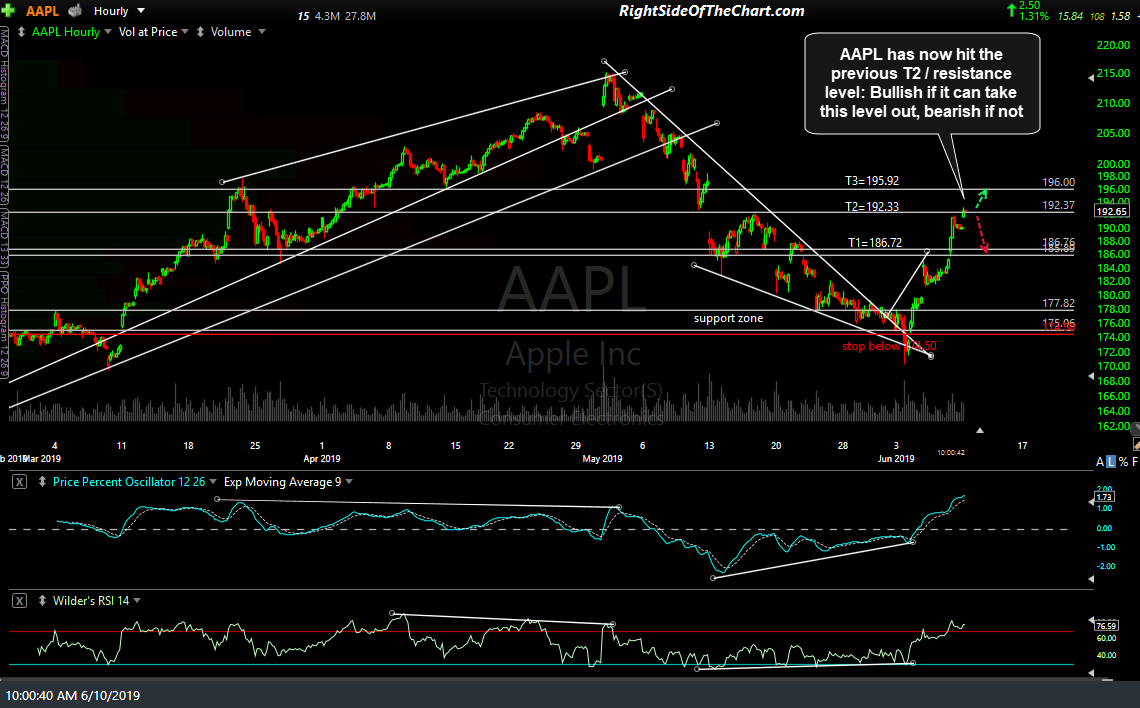
AAPL has now hit the previous T2 / resistance level: Bullish if it can take this level out, bearish if not. 60-minute chart below.
AAPL 60-min June 10th
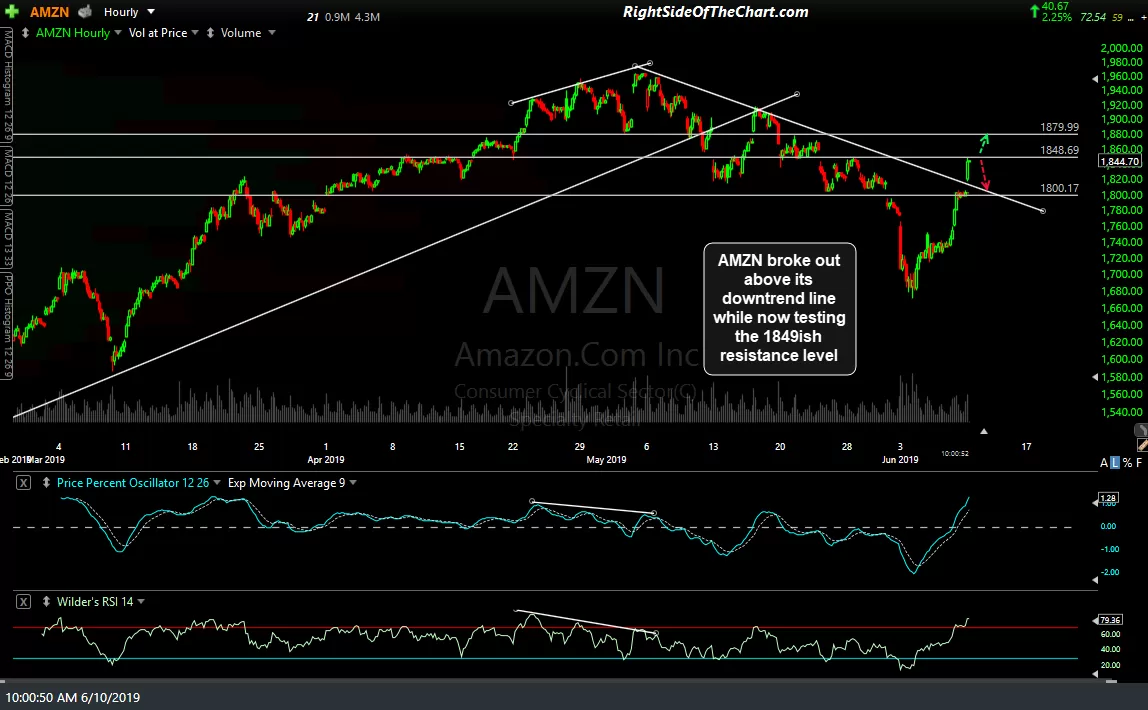
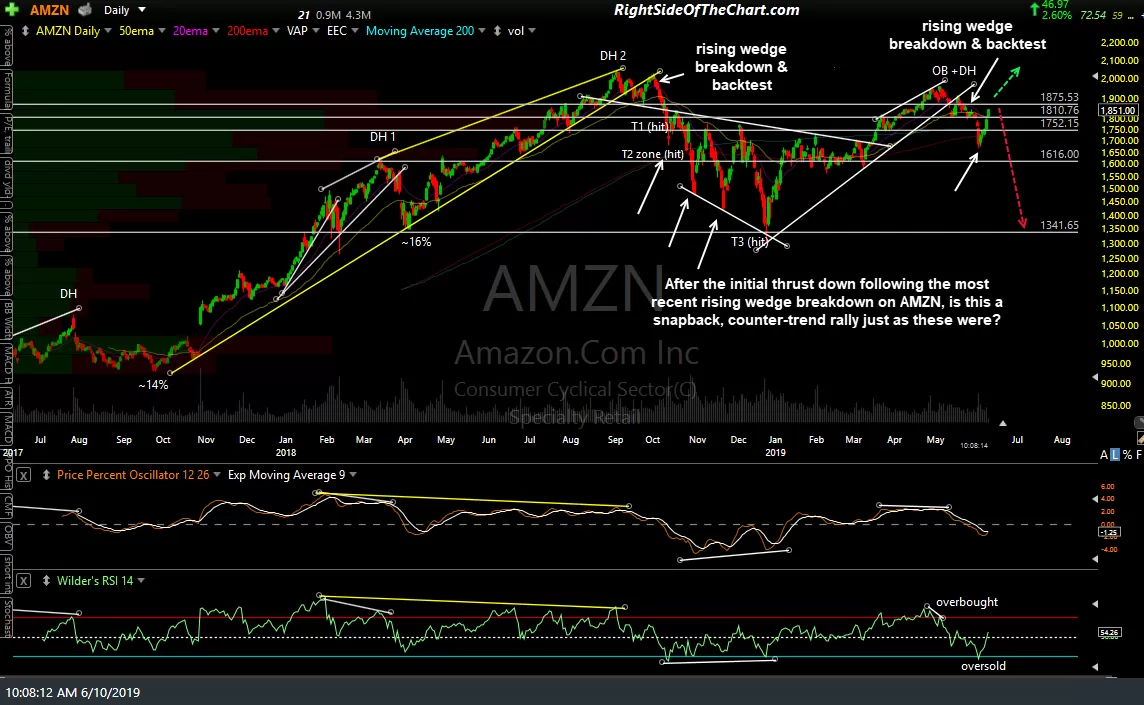
AMZN broke out above its downtrend line while now testing the 1849ish resistance level on the 60-minute chart (1st chart below). Zooming out to the daily chart (2nd below), after the initial thrust down following the most recent rising wedge breakdown on AMZN, one has to consider whether this is a snapback, counter-trend rally just as those previous counter-trend rallys during October & November were before AMZN finally bottomed in late December.
-
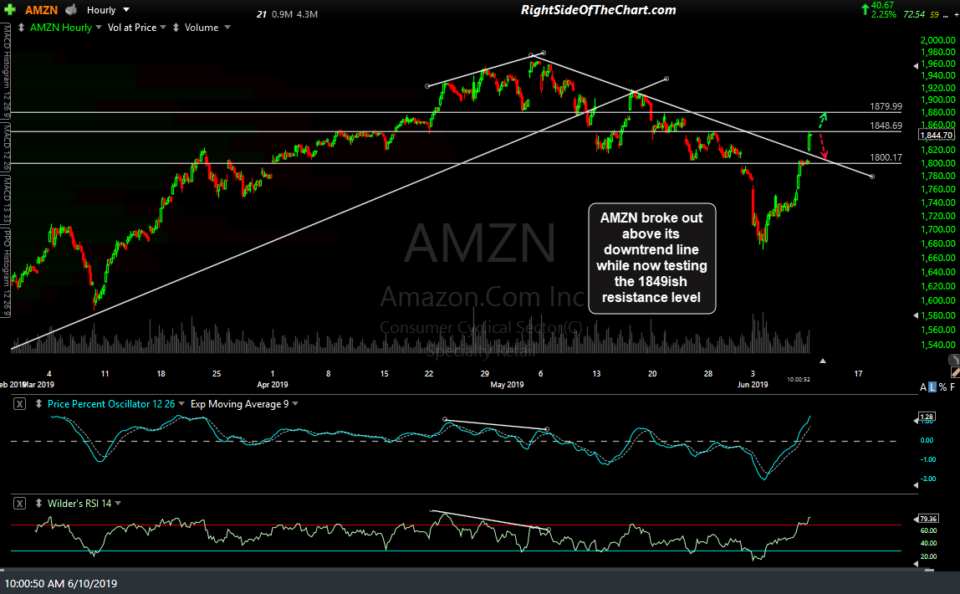
- AMZN 60-min June 10th
-
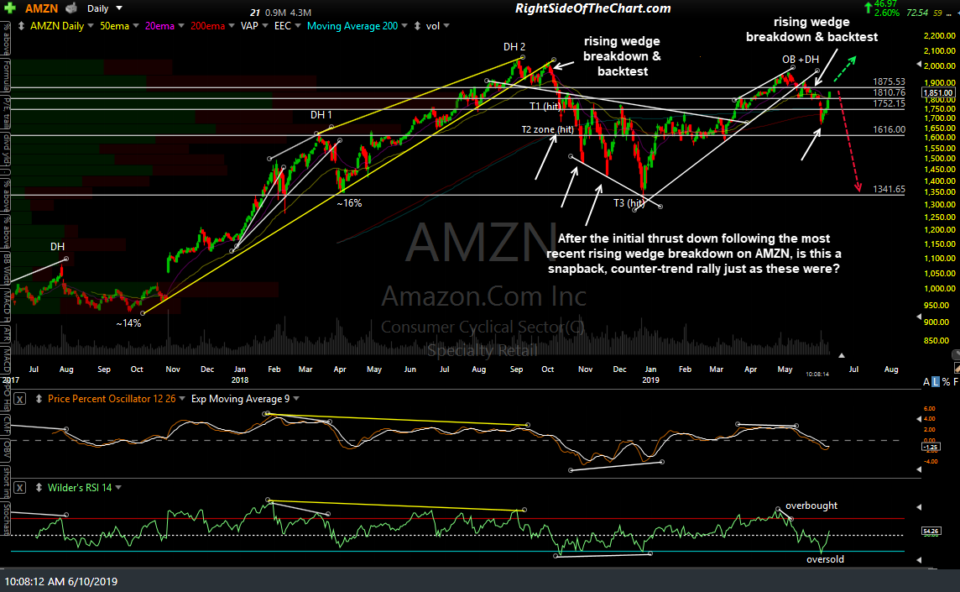
- AMZN daily June 10th
FB (Facebook Inc.) hit & so far reversed off the 177ish resistance level today. As such, a solid break & 60-minute close above that level would be bullish while a failure to do so bearish.
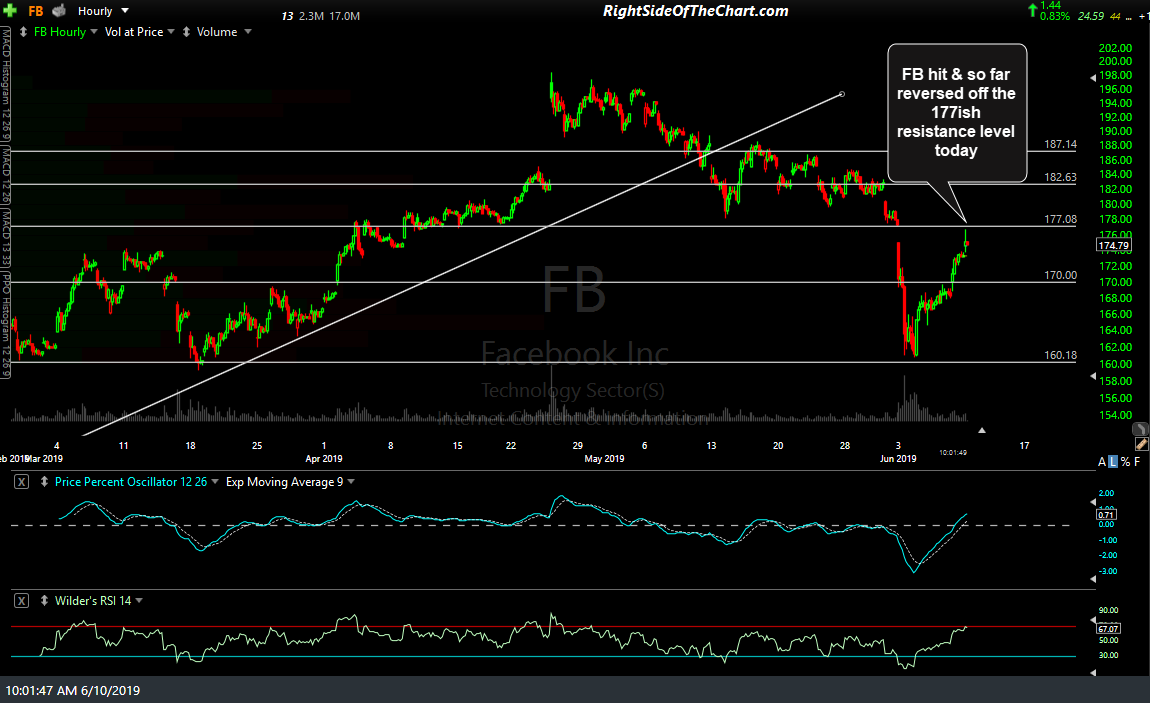
FB 60-min June 10th
GOOGL is now testing downtrend line resistance with the next resistance at the top of the gap around 1102.37. 60-minute chart below.
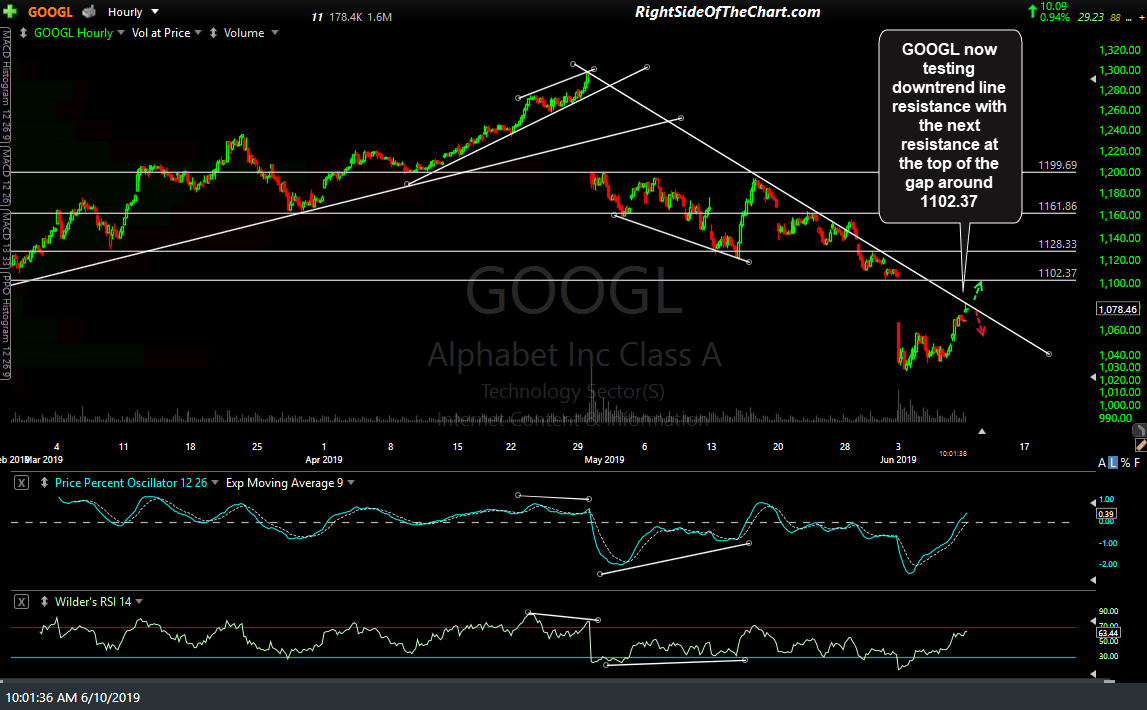
GOOGL 60-min June 10th