
As long as SPY & QQQ remain within these recent trading ranges (yellow box), they are likely to grind around with relatively small, yet fairly sharp micro-trends that are best navigated on the intraday charts by active traders & ignored by typical swing & trend traders.
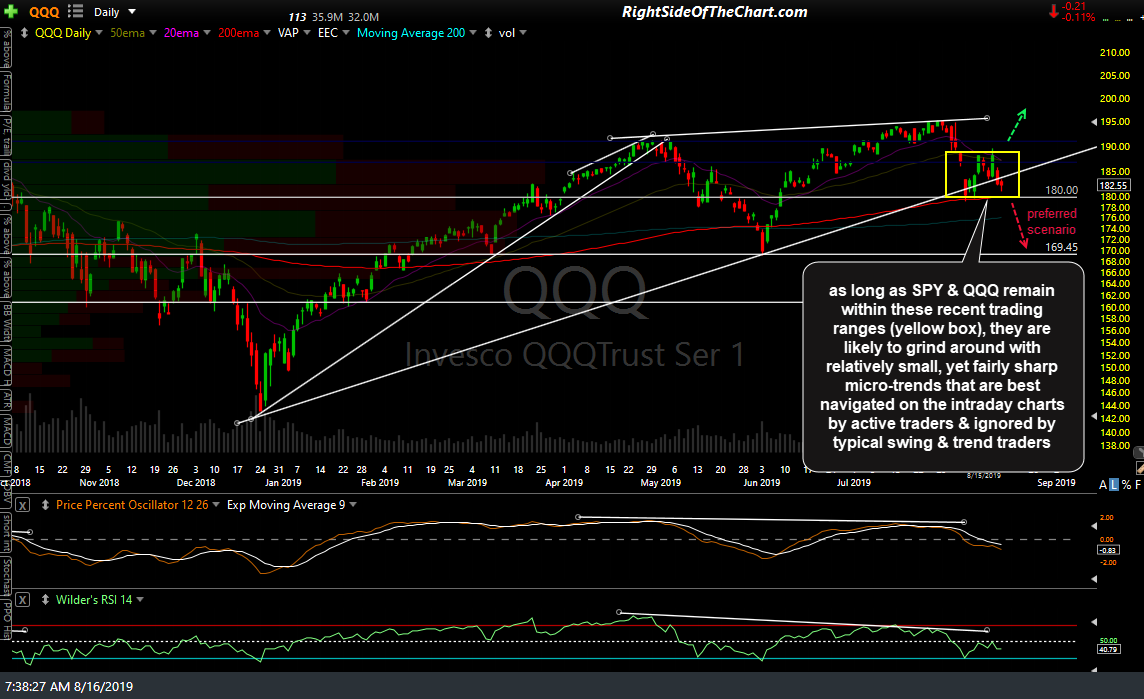
QQQ daily Aug 15th close 2
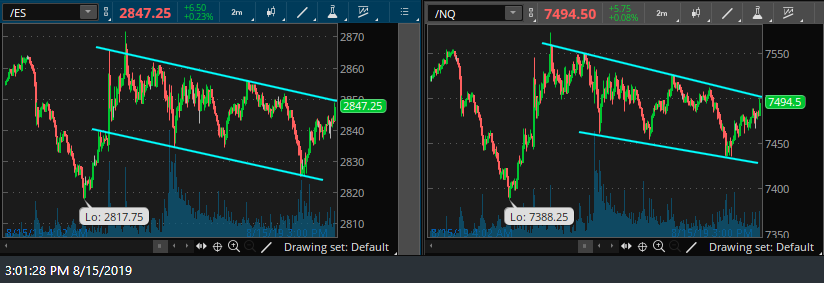
For example, I had to cut out early yesterday, posting the following short-term trade setup & 2-minute charts of /ES & /NQ in the trading room just before leaving my desk:
(I) need to run out for about an hour & will get back to any questions later today. Until then, here are some downtrend lines/price channels on the 2-min charts of /ES &/NQ to watch or trade off of (e.g.- long for a day trade on a break above on both or short at the top of the channel with a stop above for a pullback trade.) Right now, it’s looking like the former might be the better of the two options.
ES NQ 2-min Aug 15th
Shortly after that post, both /NQ & /ES did go on to breakout above those ‘micro’ trendlines, as suspected, followed by a successful backtest on both with that breakout being the technical catalyst for the 1½% rally (so far) since then. As of now, I’m watching for a break below the upper-most (red) micro trendline on both /NQ & /ES for the next sell signal in the index futures and if/when that occurs soon, as I suspect, then I will be watching for a potential reaction off the lower (orange) trendlines, which would provide a third reaction to help validate those potential trendlines as significant levels to watch for short-term trading opps. Once again, less active/nimble swing & trend traders shouldn’t be overly concerned with developments on the 1-5 minutes charts such as these. (5-minute charts of /NQ & /ES are shown below as I had to zoom out to that larger time frame to include those trendline/price channel breakouts from the 2-minute charts that I posted yesterday).
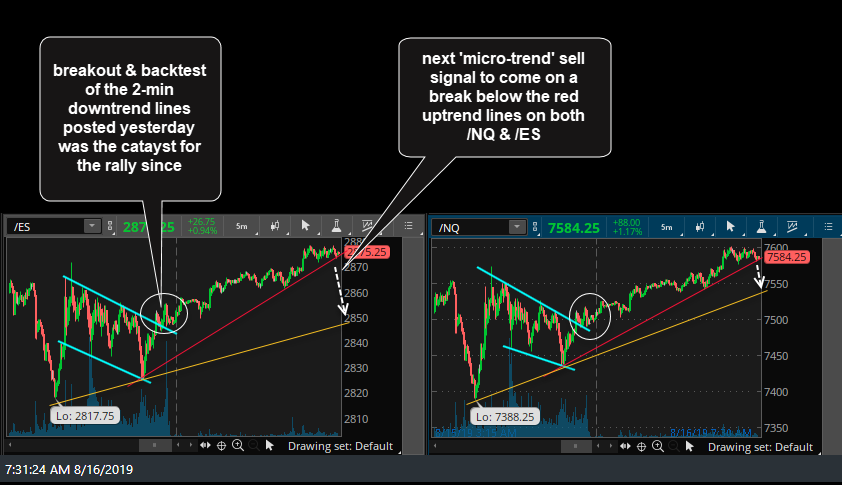
NQ ES 5-min Aug 16th