
QQQ continues to wedge higher without any sell signals although a solid break and/or 60-minute close below the wedge would likely trigger a correction. 15-minute chart, including pre-market trades, below.
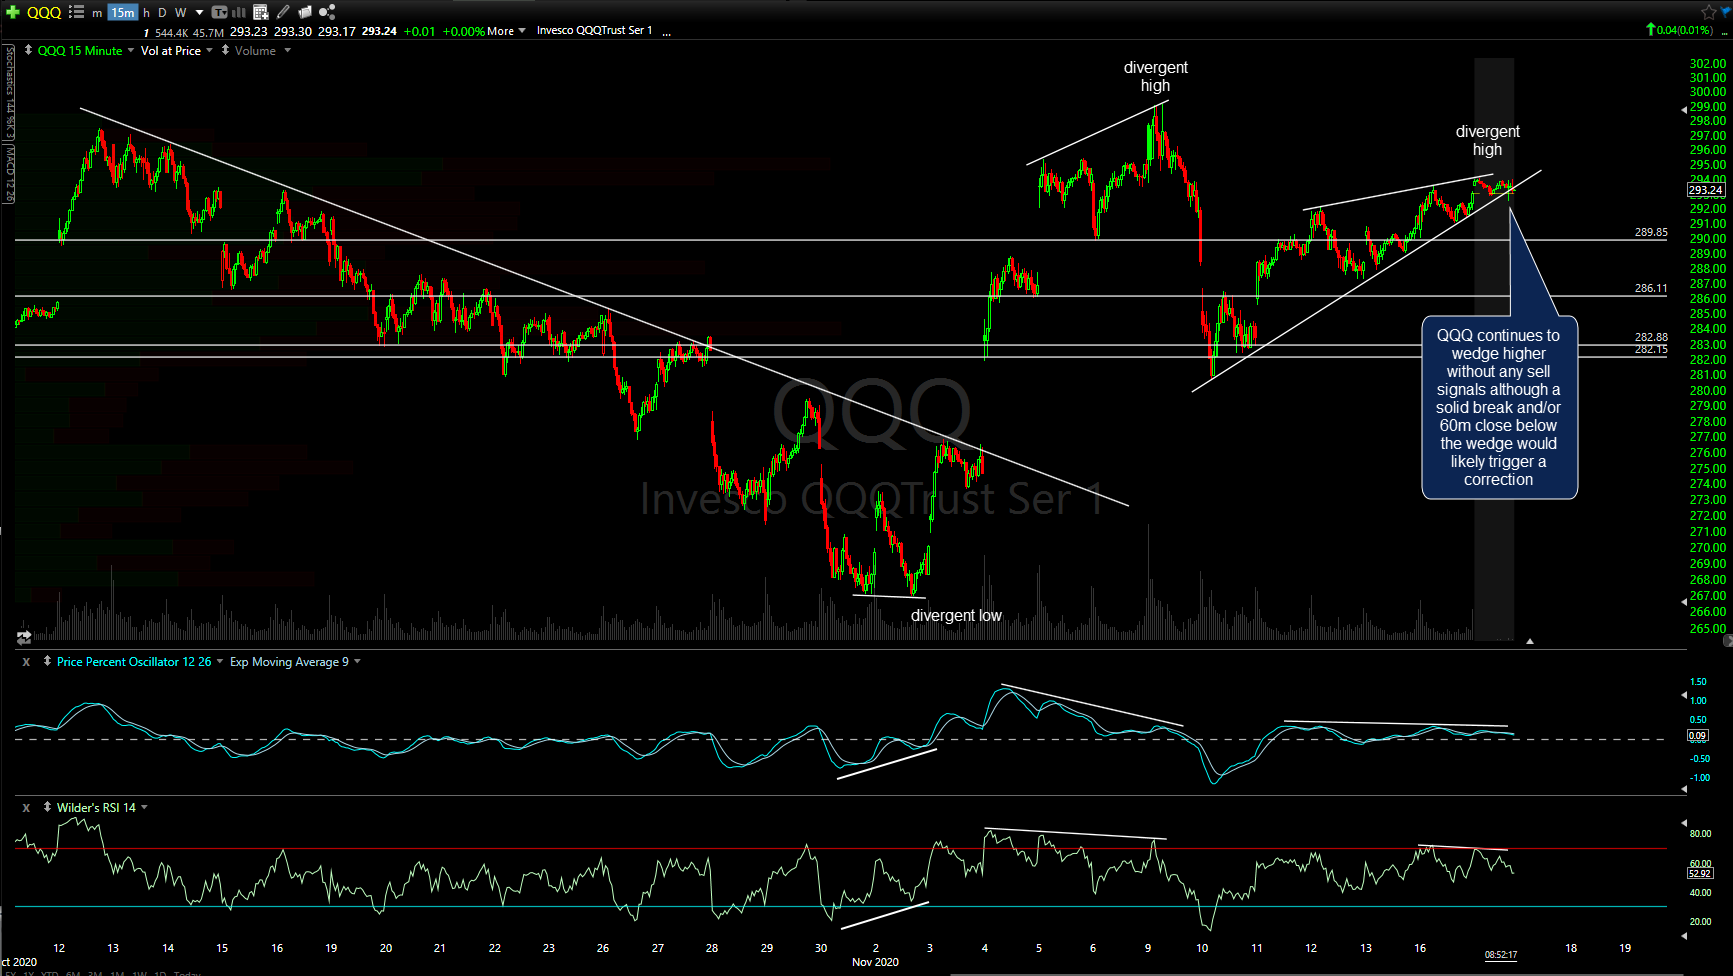
QQQ 15m Nov 17th
Likewise, /NQ also continues to wedge higher on this 60-minute time frame without any sell signals although a solid break and/or 60-minute close below the wedge would likely trigger a correction.
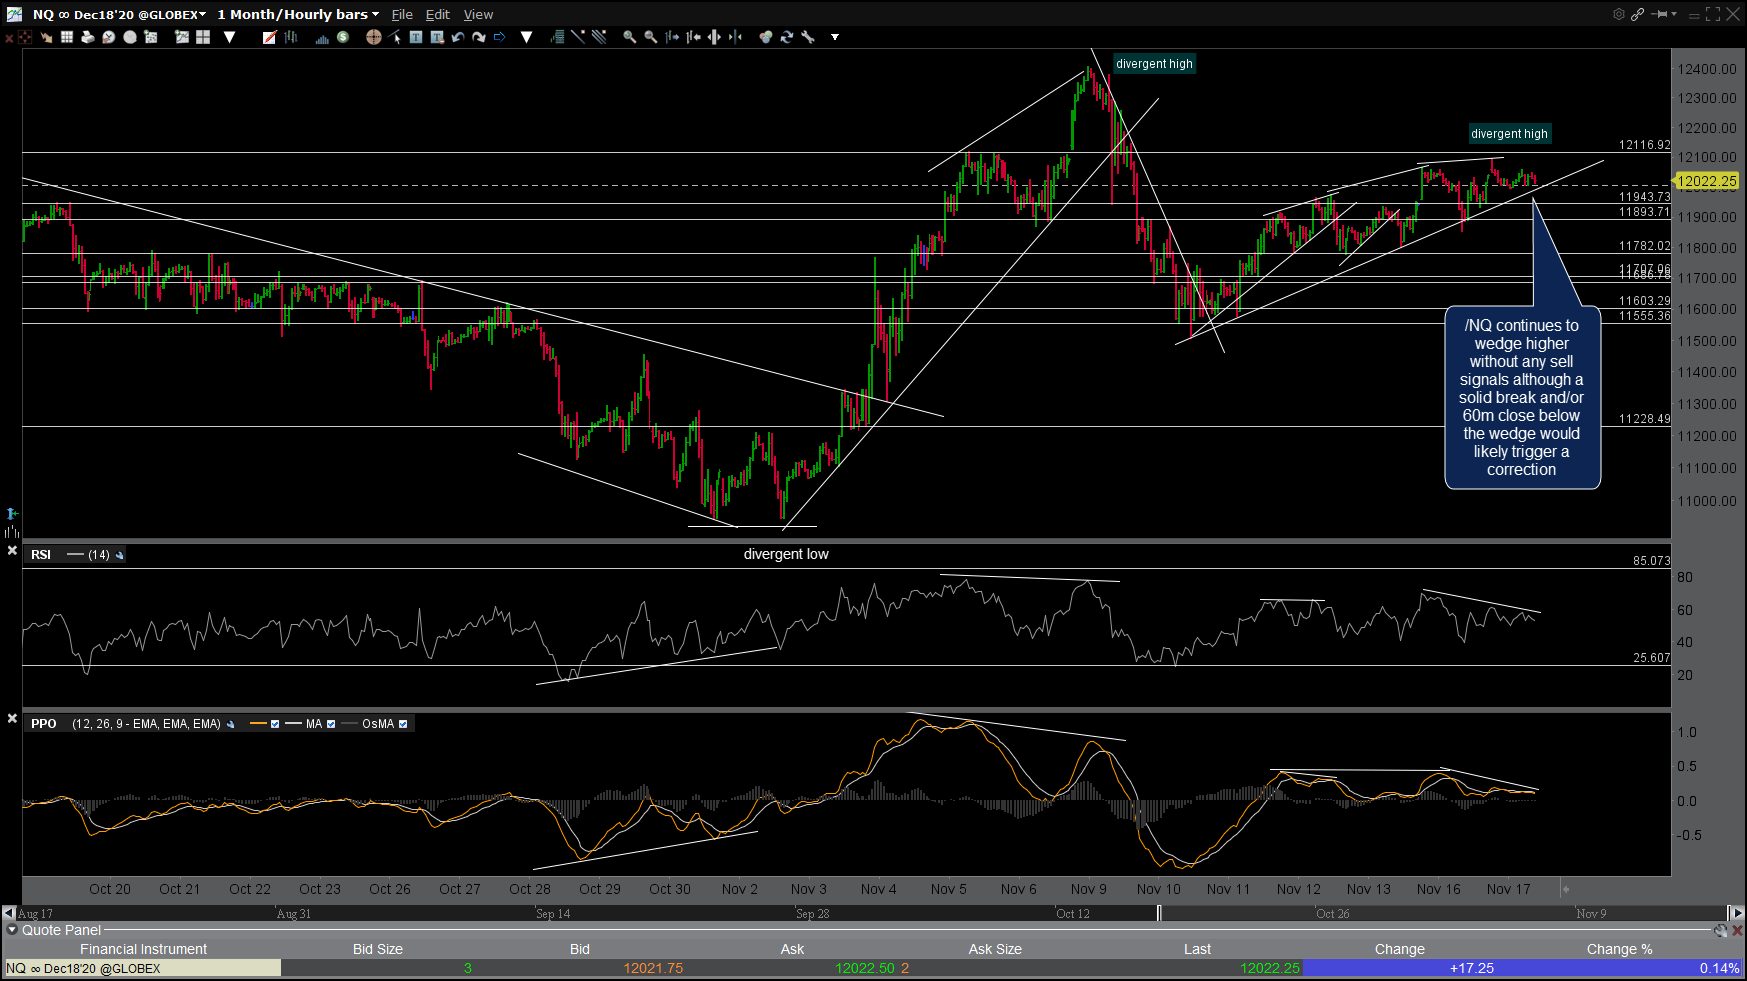
NQ 60m Nov 17th
Regarding upside targets, there really aren’t any other than a couple of previous reaction highs just above. When an index or security makes new highs, there are no longer any overhead resistance levels to target. However, my expectation for the Nasdaq 100 remains the same as it has been for the S&P 500 for a while now; any new all-time high will most likely be limited (maybe 2-8% or so) before a decent correction as breakouts to new highs that occur with negative divergences fail shortly afterward more often than not. As such, while the current near-term trend is bullish (with the intermediate-term trend still sideways/neutral for the past 3½ months), the R/R for new long positions on the indexes is not very favorable nor do we have any sell signals at this time which makes shorting not objective either, at least until & unless we get the aforementioned sell signals & even then, those might only prove to be relatively minor pullback trades for active traders.
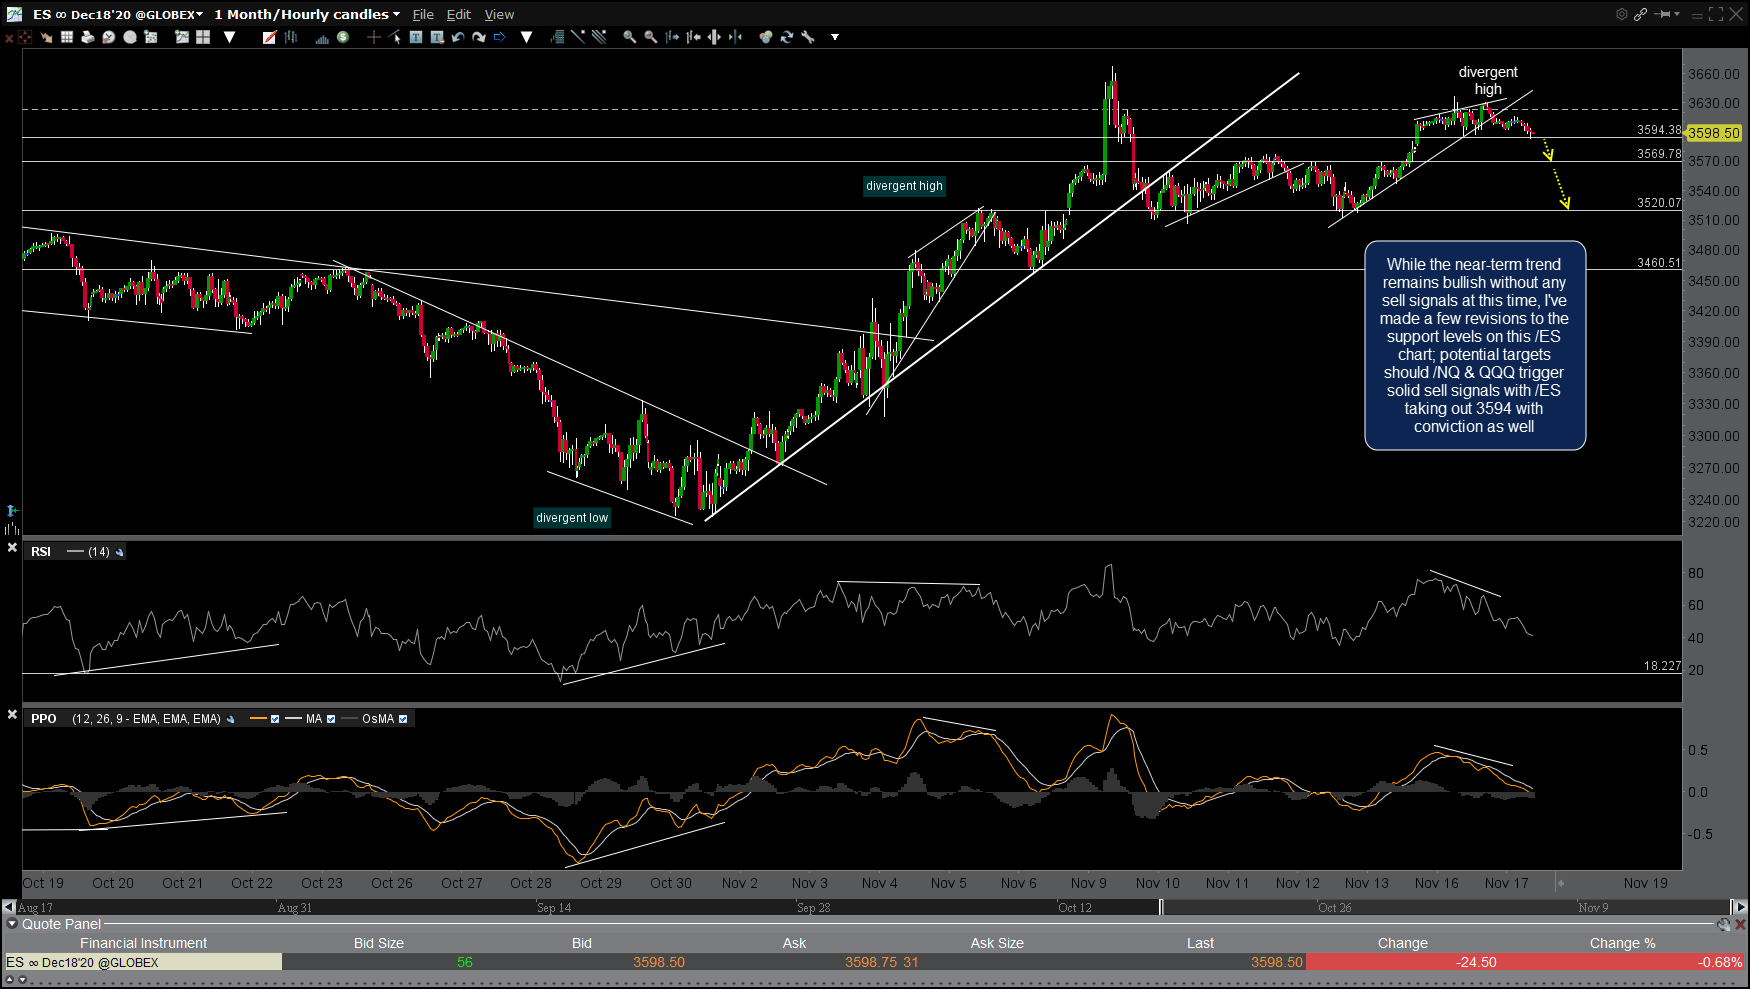
ES 60m Nov 17th
While the near-term trend remains bullish without any sell signals at this time, I’ve made a few revisions to the support levels on the/ES (S&P 500 futures) chart above; potential targets should /NQ & QQQ trigger solid sell signals with /ES taking out 3594 with conviction as well.
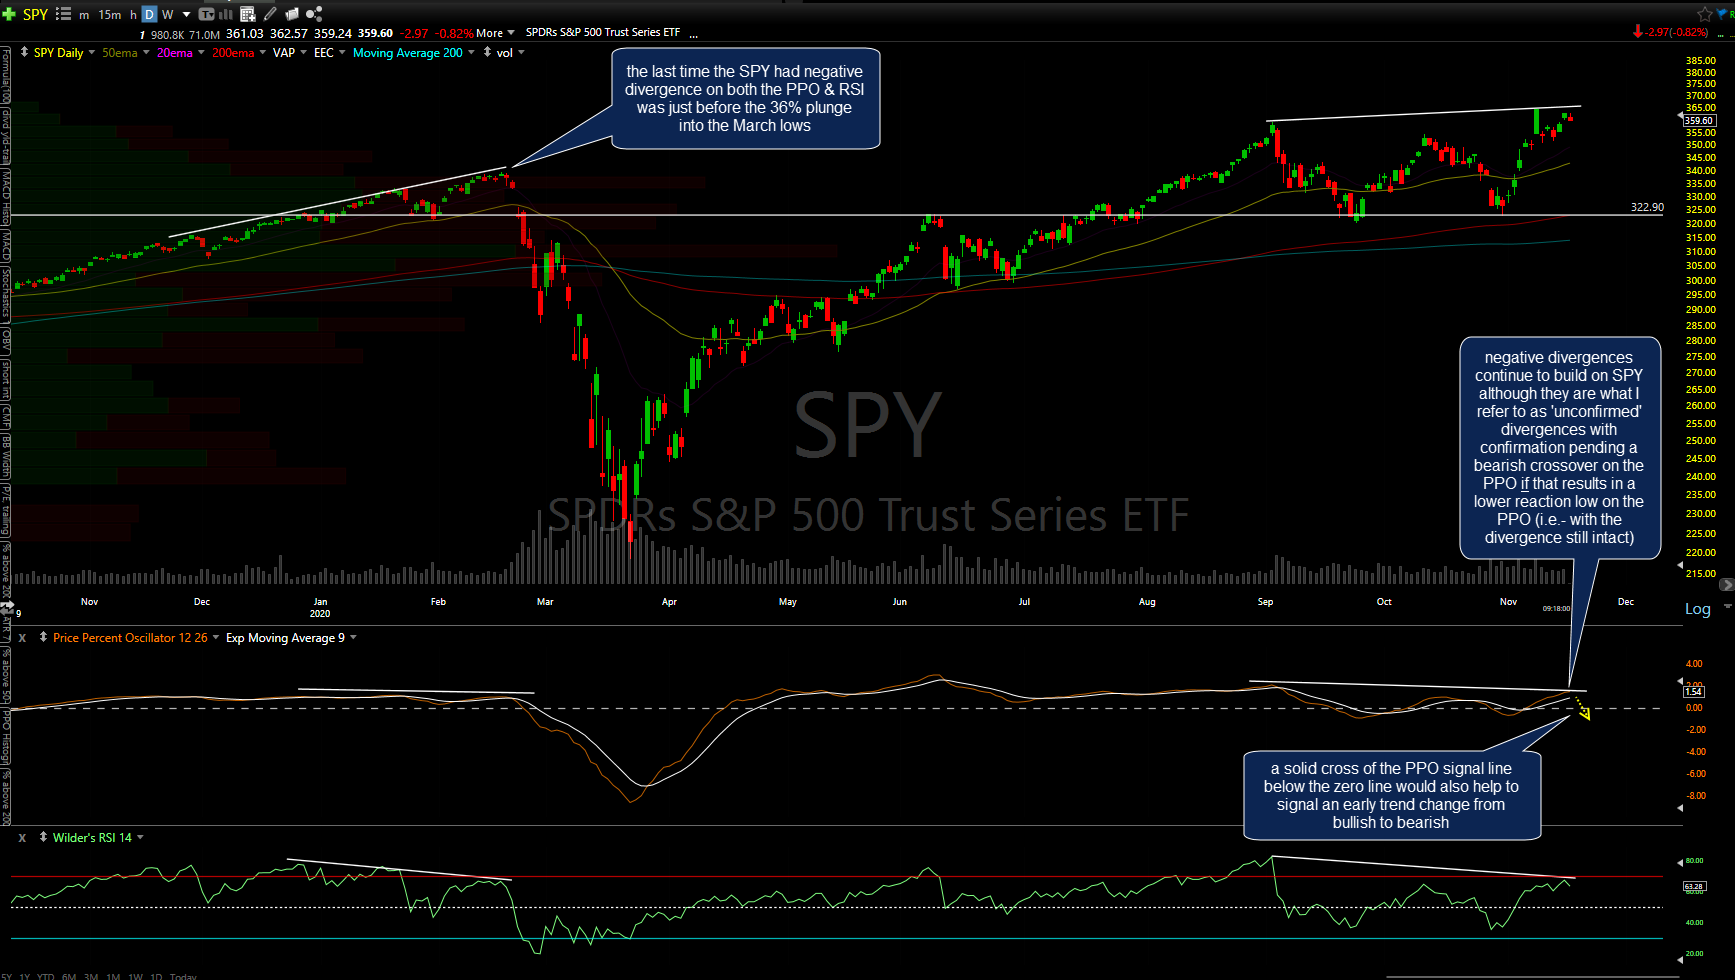
SPY daily Nov 17th
Zooming out to the more significant daily time frame above, negative divergences continue to build on SPY although they are what I refer to as ‘unconfirmed’ divergences with confirmation pending a bearish crossover on the PPO if that results in a lower reaction low on the PPO (i.e.- with the divergence still intact). A solid cross of the PPO signal line below the zero line would also help to signal an early trend change from bullish to bearish.