
The 60-minute charts below list some of the nearby support levels on the stock index ETFs & futures which, if taken out with conviction, would be a likely catalyst for a pullback to any or all of the support levels/price targets on the 60-minute charts below.
-
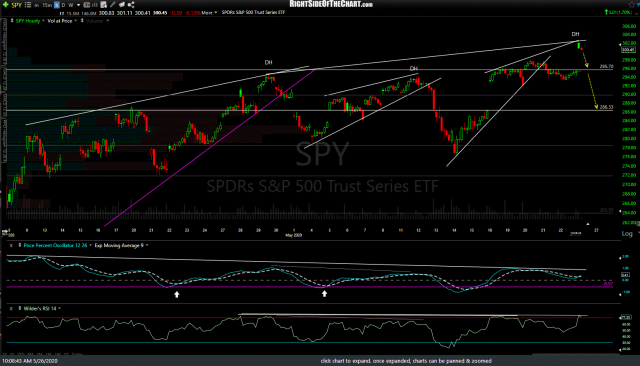
- SPY 60m 2 May 26th

-
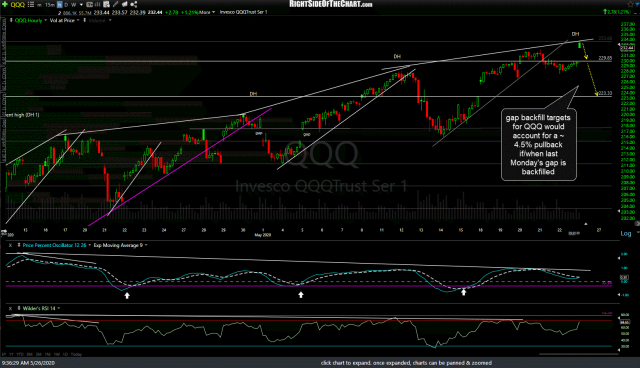
- QQQ 60m May 26th

-
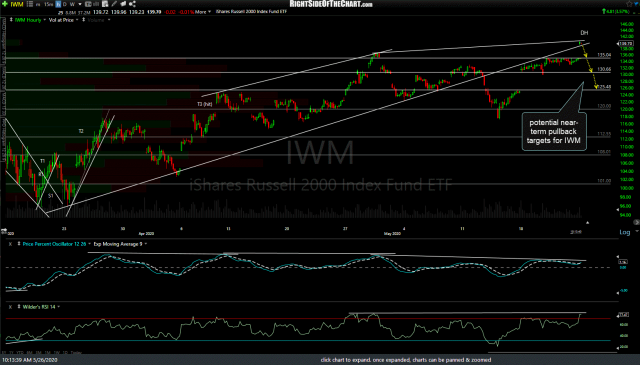
- IWM 60m May 26th

-
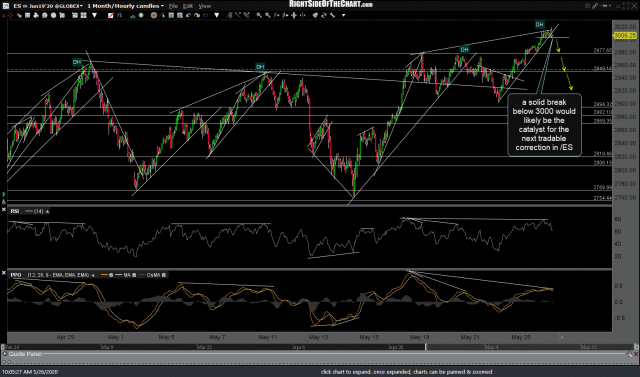
- ES 60m May 26th

-
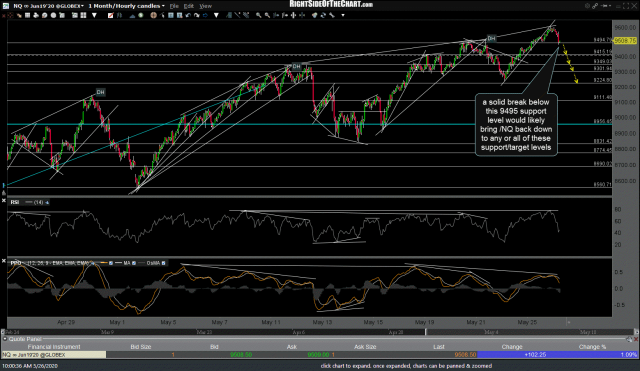
- NQ 60m May 26th

-
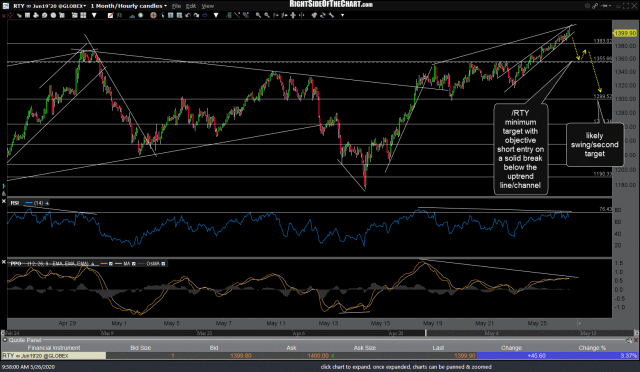
- RTY 60m May 26th

Despite the broad market gapping up & trading just above the multi-week trading range today (a bullish technical event until & unless today’s gap is faded), based on the proximity to some key resistance levels just overhead on the more significant daily & weekly charts coupled with the negative divergences that are still intact on the 60-minute time frames as well as the favorable probability that one or both of the gaps over the past week will soon be backfilled, from a pure R/R perspective, a short entry on any of the index ETFs or futures contracts around current levels with a relatively tight stop of 1-3%, depending on one’s price target(s) seems objective.