This is my reply to the first of three great questions that member @sur-non posted in the trading room today. As others might find my response useful, I figured that I would share it here on the front page of the site for all to see (with the other two questions & responses to follow).
Q: Randy, I was reading one of your old posts, maybe late ’16? – sentiment indicators – bull to bear spread, put to call ratio, extremes – wonder if those might be interesting in light of present market circumstances
A: Yes, I do find a lot of value in the various sentiment indicators such as put/call spreads, short interest ratios, the AAII Investor Sentiment Survey, the VIX (minus the 2017 infamous but now broken short vol trade), etc. However, I find those indicators absolutely worthless UNLESS they are at or near the high or low end of their historical extremes. Any readings in-between the extremes, which is where most of the sentiment indicators reside for the vast majority of time, is simply noise with very little, if any, predictive value of a major turn in the market.
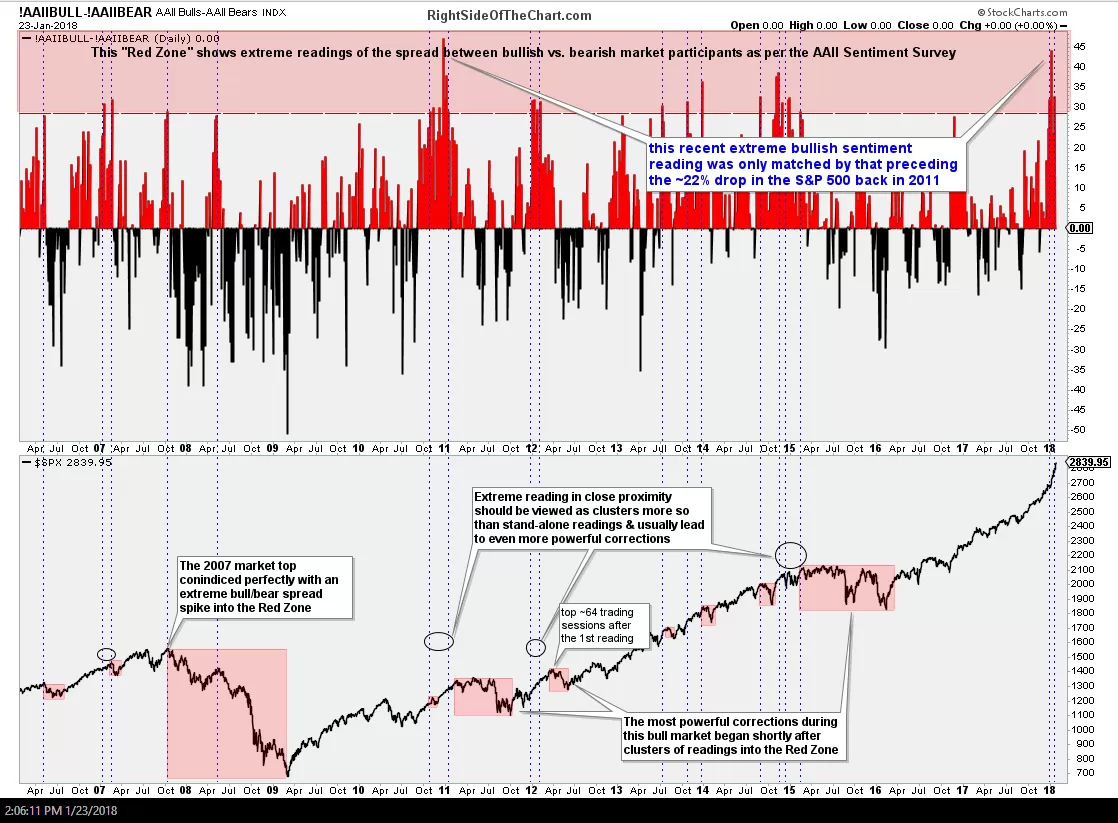
Here’s the AAII Bull/Bear Spread, which I last posted on Jan 23rd (click on the title above the excerpt below to view the full post) along with additional supporting data that bullish sentiment was at dangerously high levels. That post was published just 3 days before the market topped & experienced the sharpest correction in years:
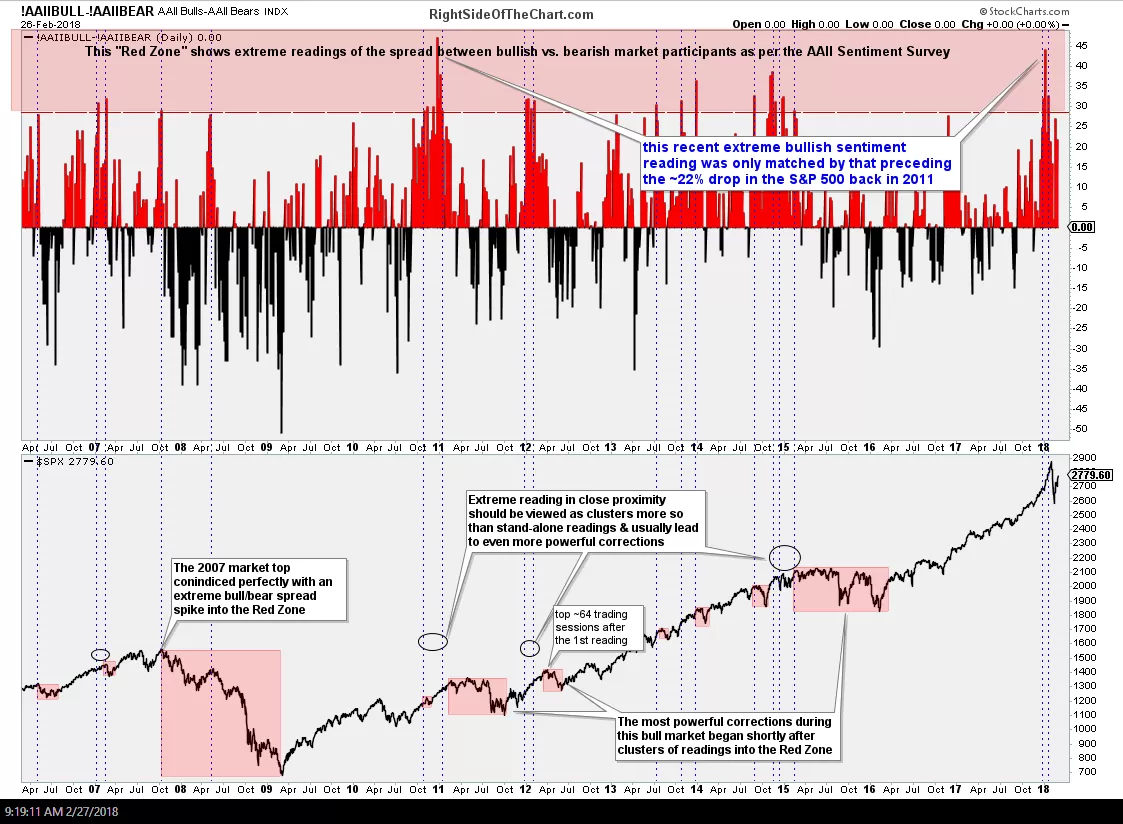
However, as you can see from the updated chart below (preceded by the previous two charts from the Jan 23rd post above), the Bull-Bear spread (differential between those bullish & those bearish) has fallen back below my “Red Zone”, as is typically the case once a sharp correction (or rally) following an extreme reading or persistent readings makes a quick adjustment to investor sentiment. I’ll answer your other questions in a separate reply or replies. Great question on the sentiment extremes, I’m glad you asked.
-

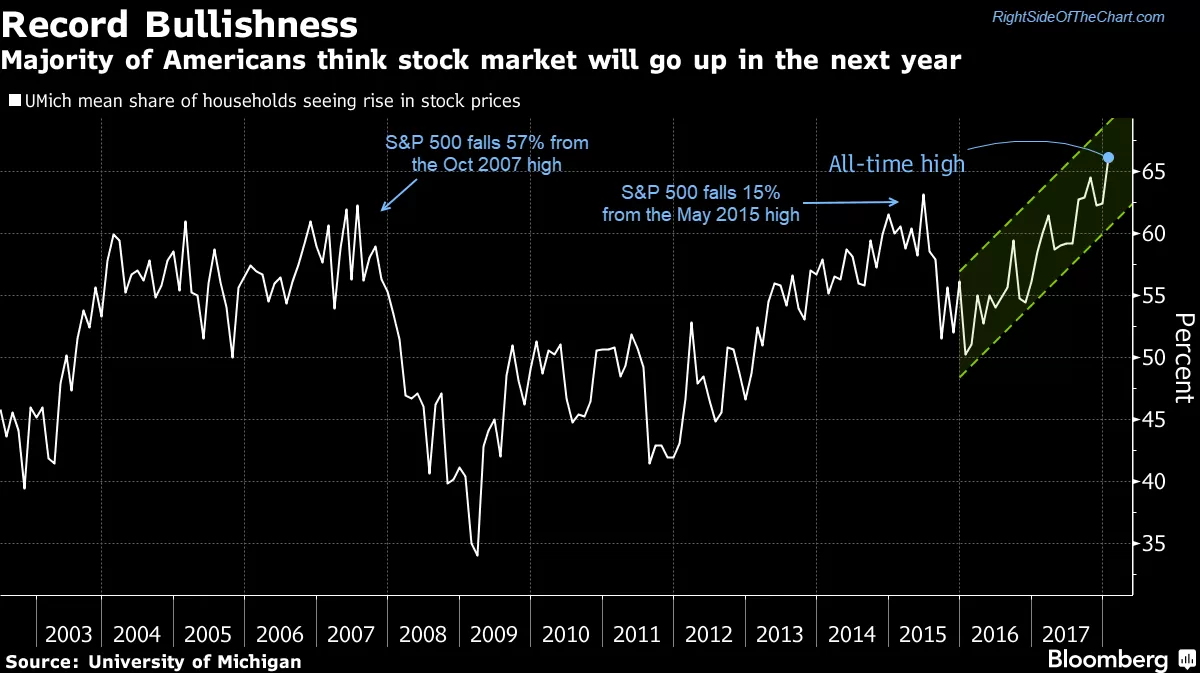
- UM Sentiment Survey
-
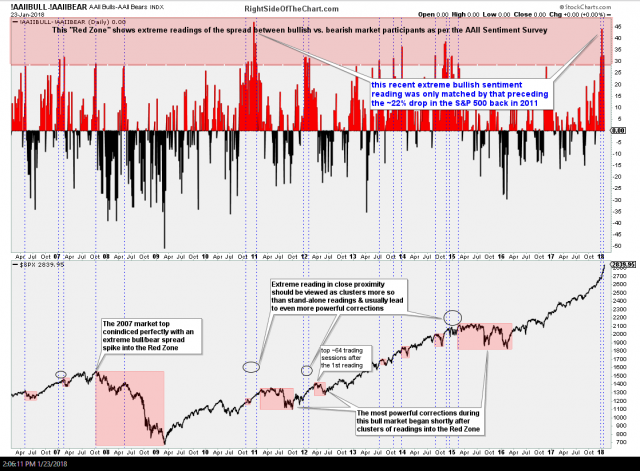
- AAII bull-bear spread 1-23-18
-

- AAII bull-bear spread 2-27-18