
A member of the site had inquired about one of the settings at the top of the daily charts that I often post, “Exp Envelope Channel 9 0.3”. I’m a firm believer of using just a handful of indicators & knowing them like the back of your hand vs. loading your chart up with tons of indicators, in which case you are likely to miss many of the signals trying to follow them all. However, I do like to experiment with new indicators or variations on the existing indicators that I use & will incorporate new indicators into my trading from time to time.
I also like to use different indicators & various settings of those indicators in different market conditions (e.g. trending vs. sideways or choppy) as well as on different securities as there aren’t many “one size (or setting) fits all” when it comes to the use of indicators on various securities & market conditions. My reply to the inquiry that I received on the Envelope Channel, along with an example in which they can be used as short-term trading signals is pasted below:
I added that indicator a while back on the suggestion of another trader. I played around with it for a bit but never fully incorporated it into my trading although I had planned to revisit it later so I left it on my daily charts (although I have the opacity turned down quite a bit so it hardly shows).
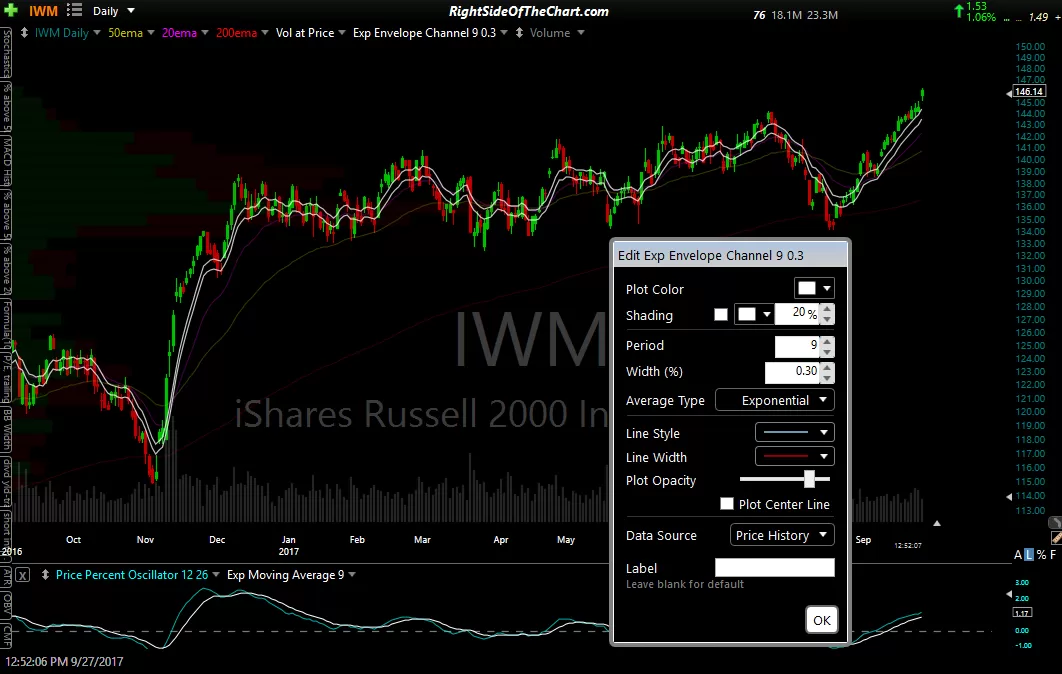
It is a moving average envelope using a 9 period exponential moving average with a % width setting of 0.30. Here is a link on how to use & configure moving average envelopes from stockcharts.com: http://stockcharts.com/school/doku.php?id=chart_school:technical_indicators:moving_average_envelopes
I’ve also pasted a screenshot of a daily chart of IWM with that envelope using white lines (I have the center line turned off). However, on this chart, for example, I would play around with the settings to increase the width in order to try to get the envelope to band around the upper & lower ends of that mostly sideways trading range from Dec to Aug like I did in the 2nd chart below by changing the width from 0.3% to 1.3%.
-

- Envelope Channel settings 1
-
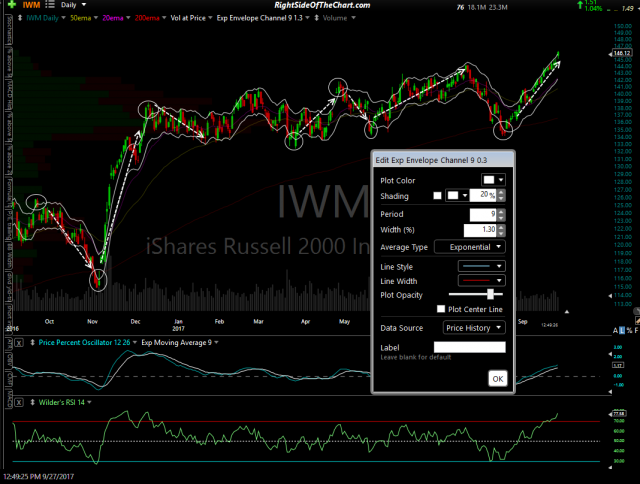
- Envelope Channel settings 2
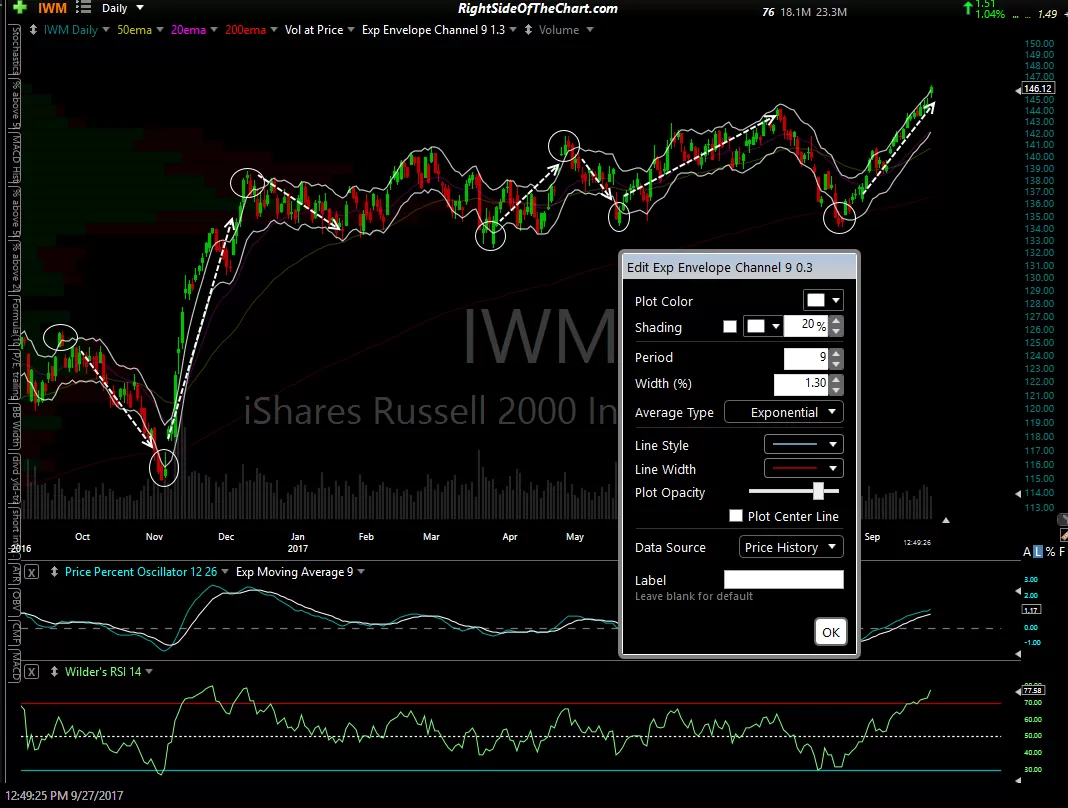
What stands out to me on that chart is the few times where I circled the candlesticks that clearly popped above or below the envelope. Note how in each instance circled that IWM reversed & moved all the way up (or down) to the upper (or lower) envelope band. In most of those instances, one could have went long (or short) IWM, closing the position when prices hit the opposite side of the envelope channel or simply set a trailing stop & let the position ride for a potentially larger trend reversal. That is similar to using candlestick pierces outside of Bollinger Bands to indicate likely trend reversal & potential trade entries (although best when used in conjunction with other buy & sell signals).