
It appears that one could make a decent bullish or bearish case on gold. Gold is currently testing the primary uptrend line support from above. Until & unless that trendline is taken out with conviction on a weekly closing basis and gold starts to take out some of the recent reaction lows, the trend off the Dec 2015 lows remains bullish. Weekly chart of $GOLD (continuous futures contract)
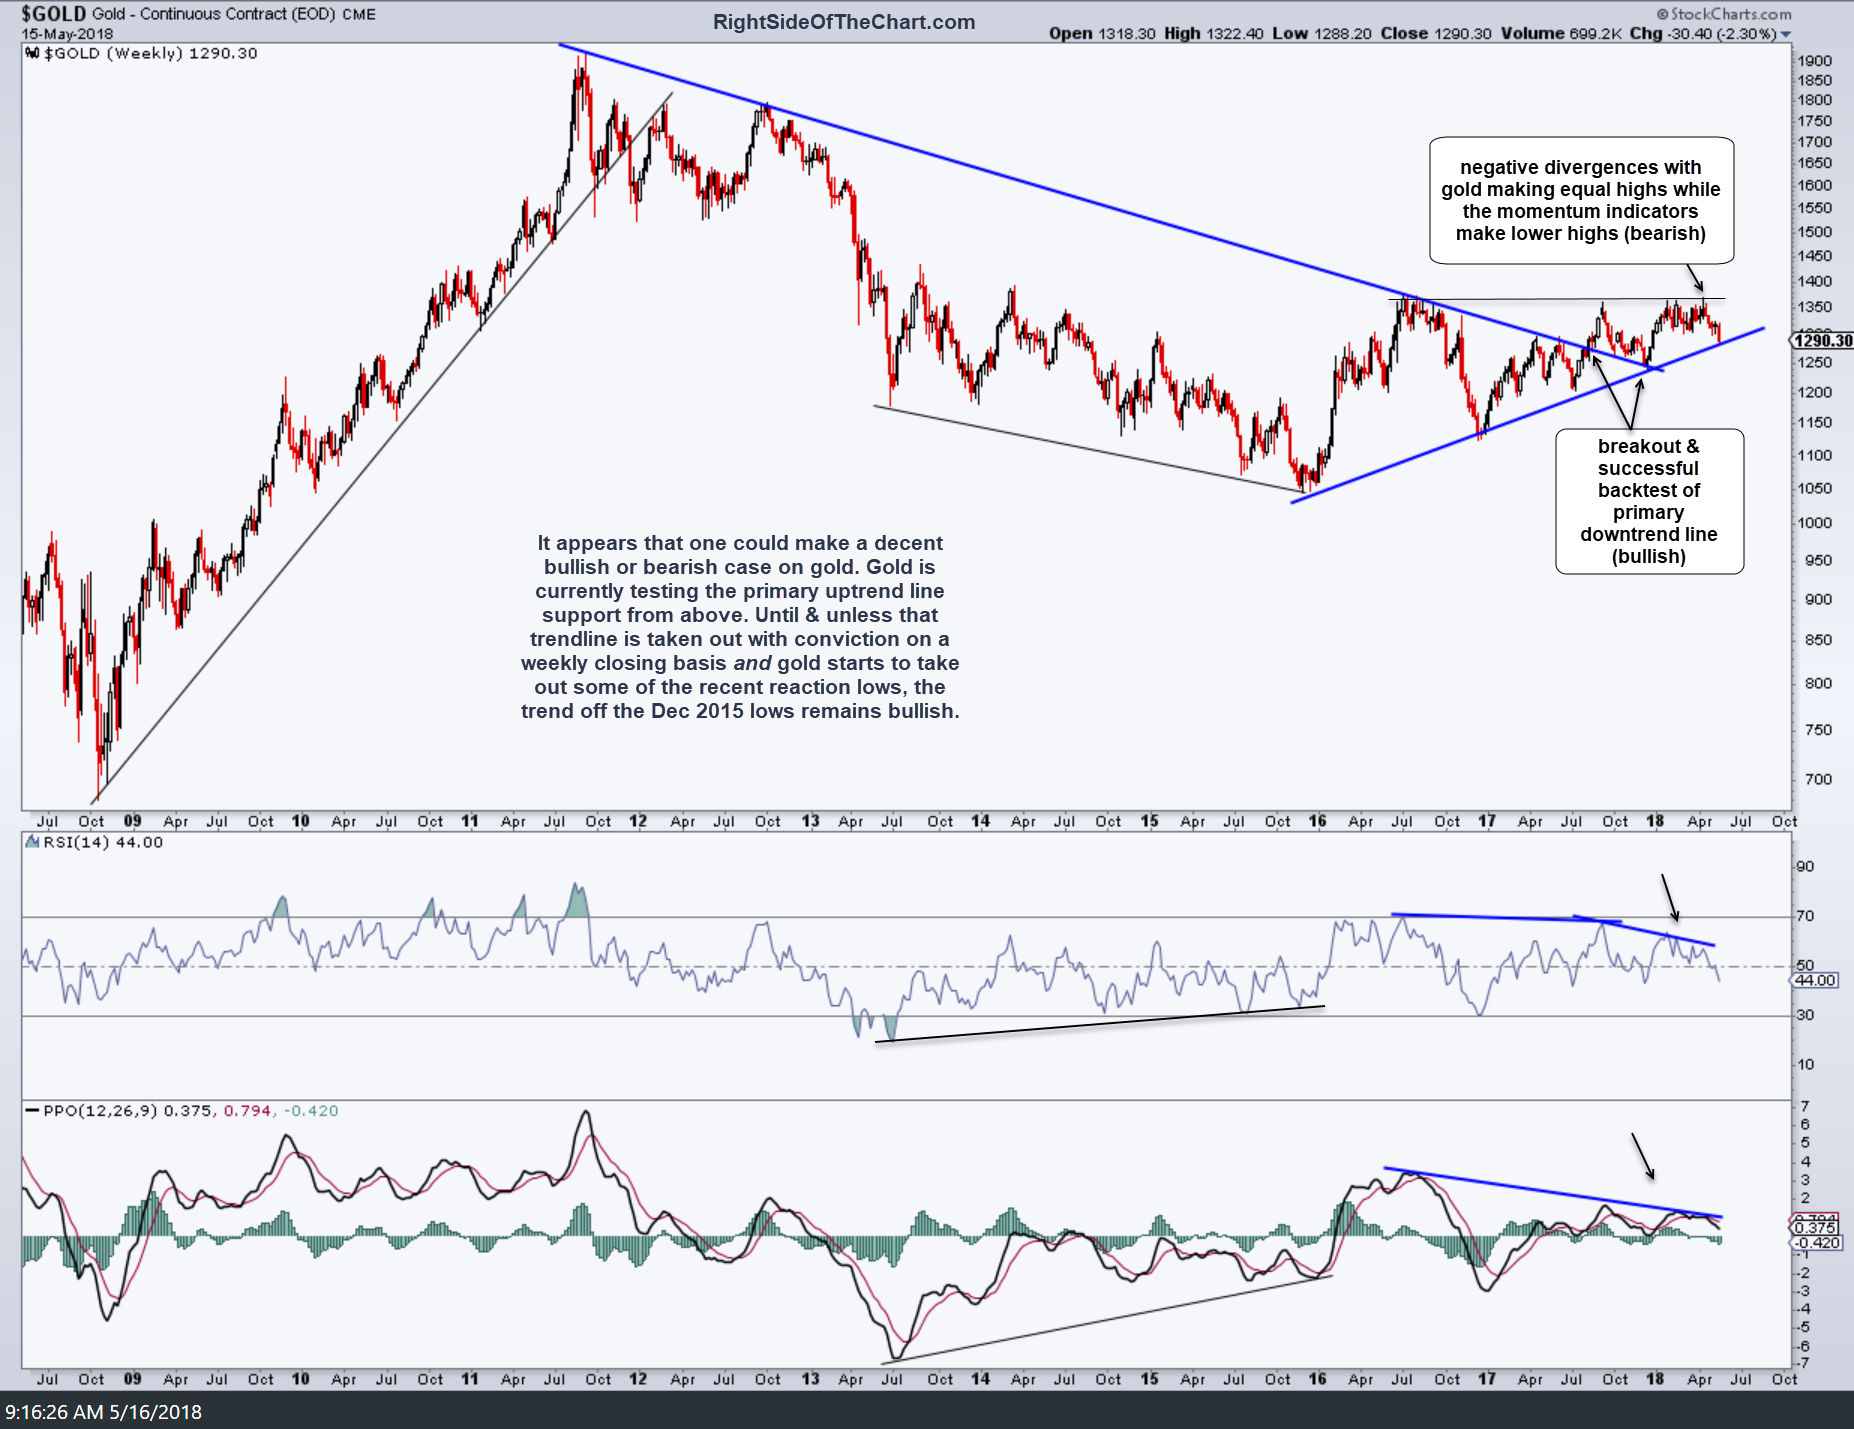
$GOLD weekly May 16th
The next chart below is a weekly chart of GLD. The PPO signal line (9-ema) trades above the zero line during bullish trends & below during bearish trends.& remains clearly above the zero line as GLD pulls back for the first test of the primary uptrend line since Dec 2017.
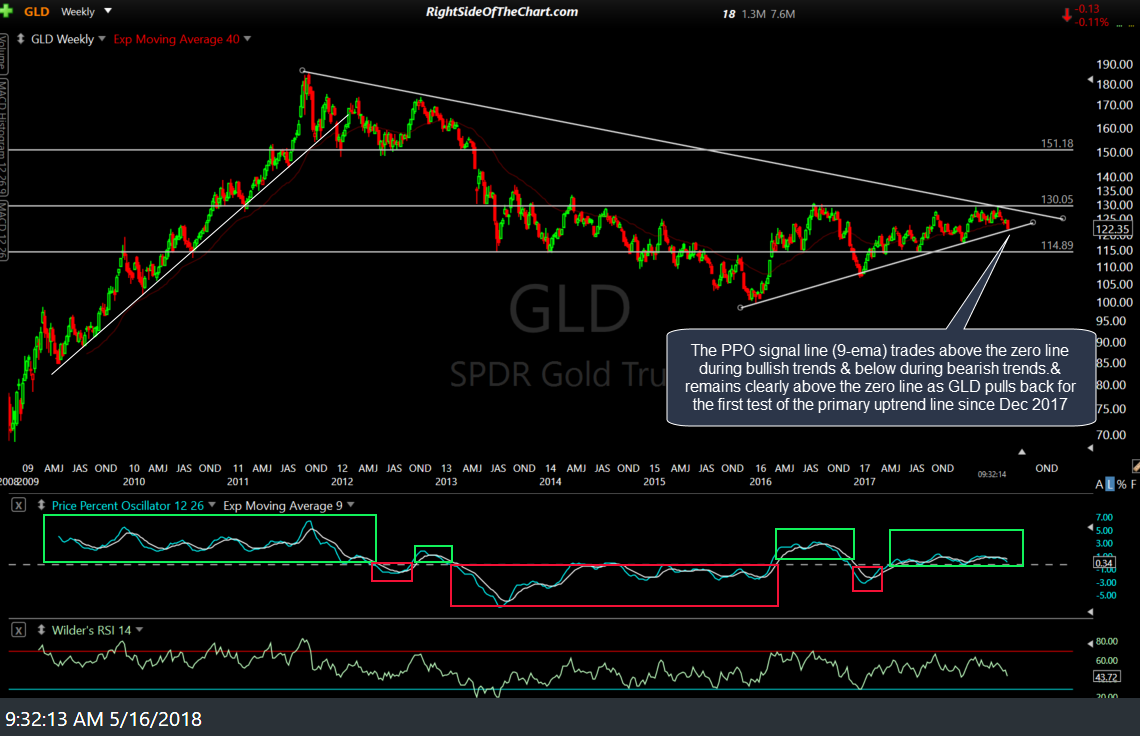
GLD weekly May 16th
Despite this undercut of the recent support zone highlighted on the daily chart of the EUR/USD in recent analysis, it still appears that the US Dollar is poised for a correction (Euro up = Dollar down) with potential bullish divergences on the EUR/SUD 60-minute chart which would like be confirmed soon on a breakout above the downtrend line.
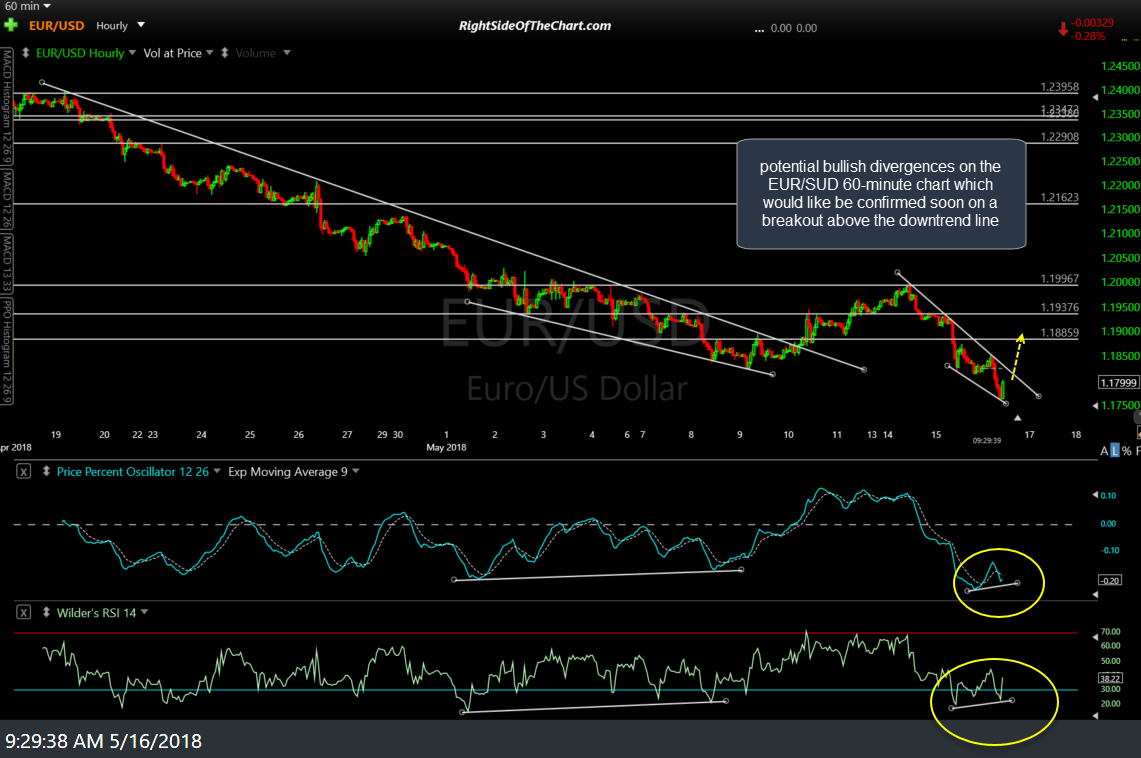
EUR-USD 60-min May 16th