
Both /GC (gold future) and GLD (gold ETF) recently put in divergent lows (i.e.- positive or bullish divergence) on the 60-minute charts with gold taking out the near-term downtrend lines, thereby providing an objective long entry here and/or on a breakout above the resistance levels just overhead for either a swing trade up to the price targets on the 60-minute charts below & as well as objective entries or add-ons to a longer-term position. Additionally, a sell signal/breakdown on the /DX (US Dollar) 60-minute chart below would also help to confirm a buy signal on gold.

GC 60m July 1st
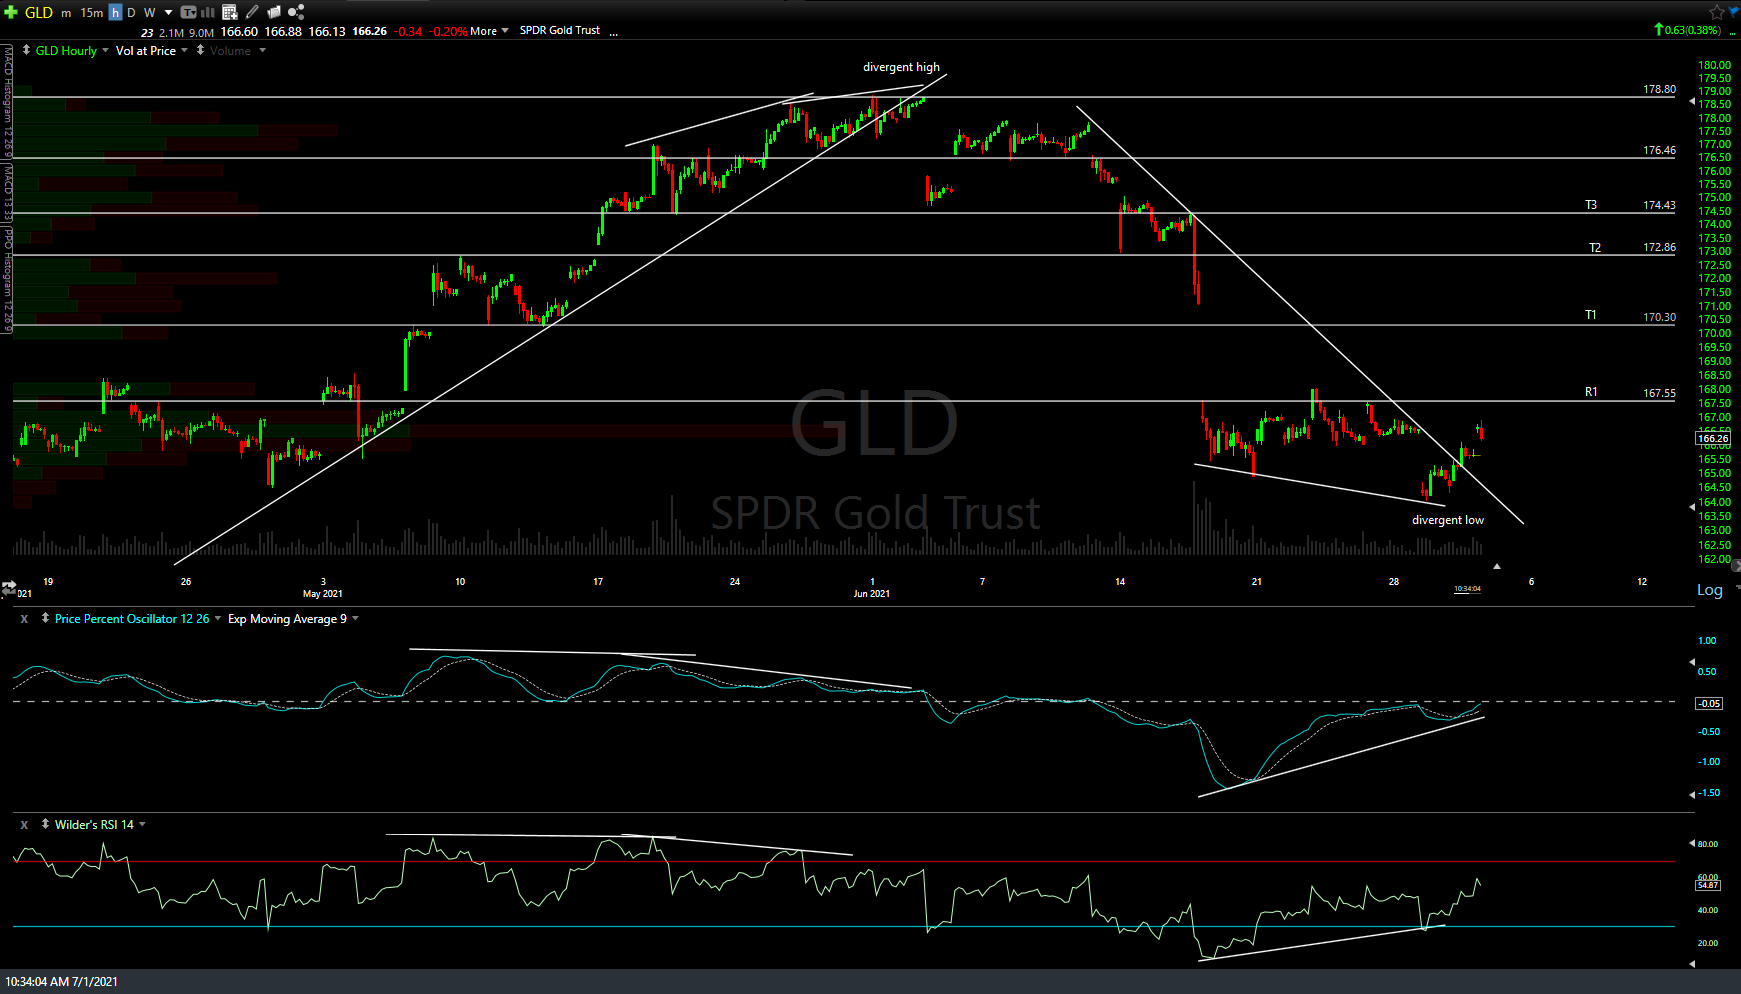
GLD 60m July 1st
/SI (silver)has been consolidating below the 26.53ish resistance level with a buy signal to come on a solid breakout above. My minimum preferred swing target, should we get a buy signal on a break above 26.53 soon, would be T2 at 27.24 with the potential for additional targets, including the 28.35ish level, to be added. 60-minute chart below.
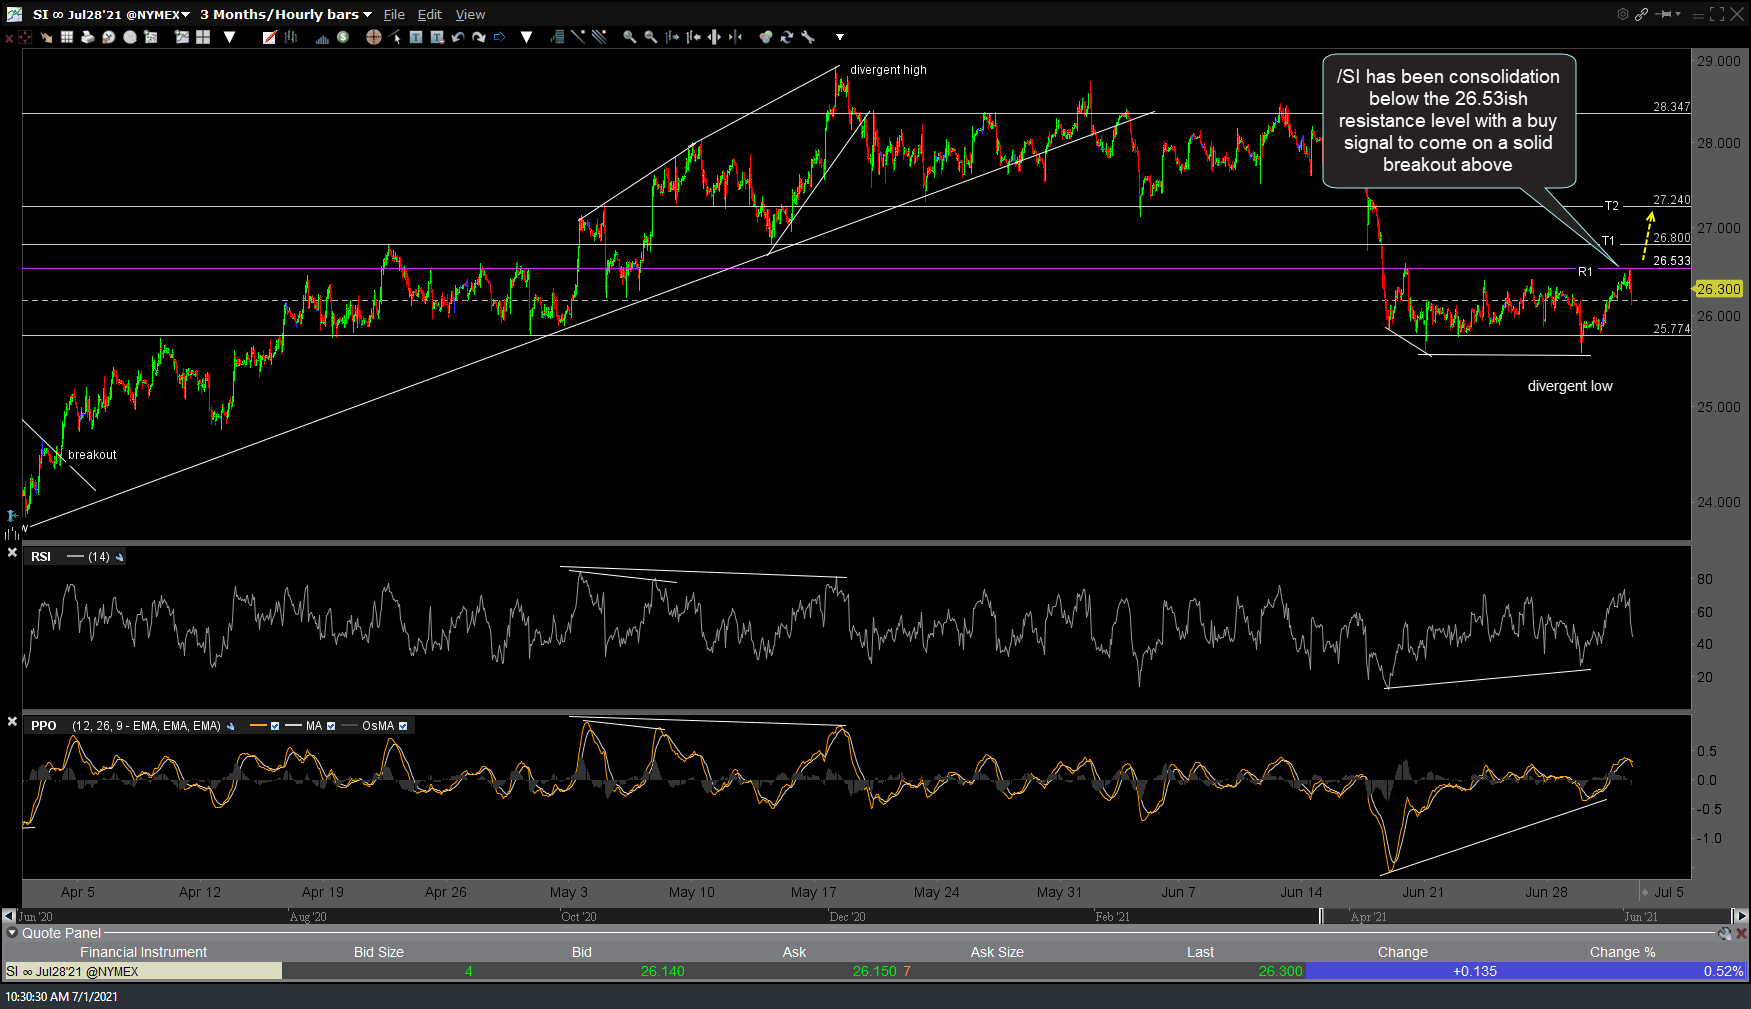
SI 60m July 1st
/DX (US Dollar) sell signal pending a solid break below this 60-minute bearish rising wedge pattern with a breakdown to help solidify a buy signal on gold, silver, & GDX.
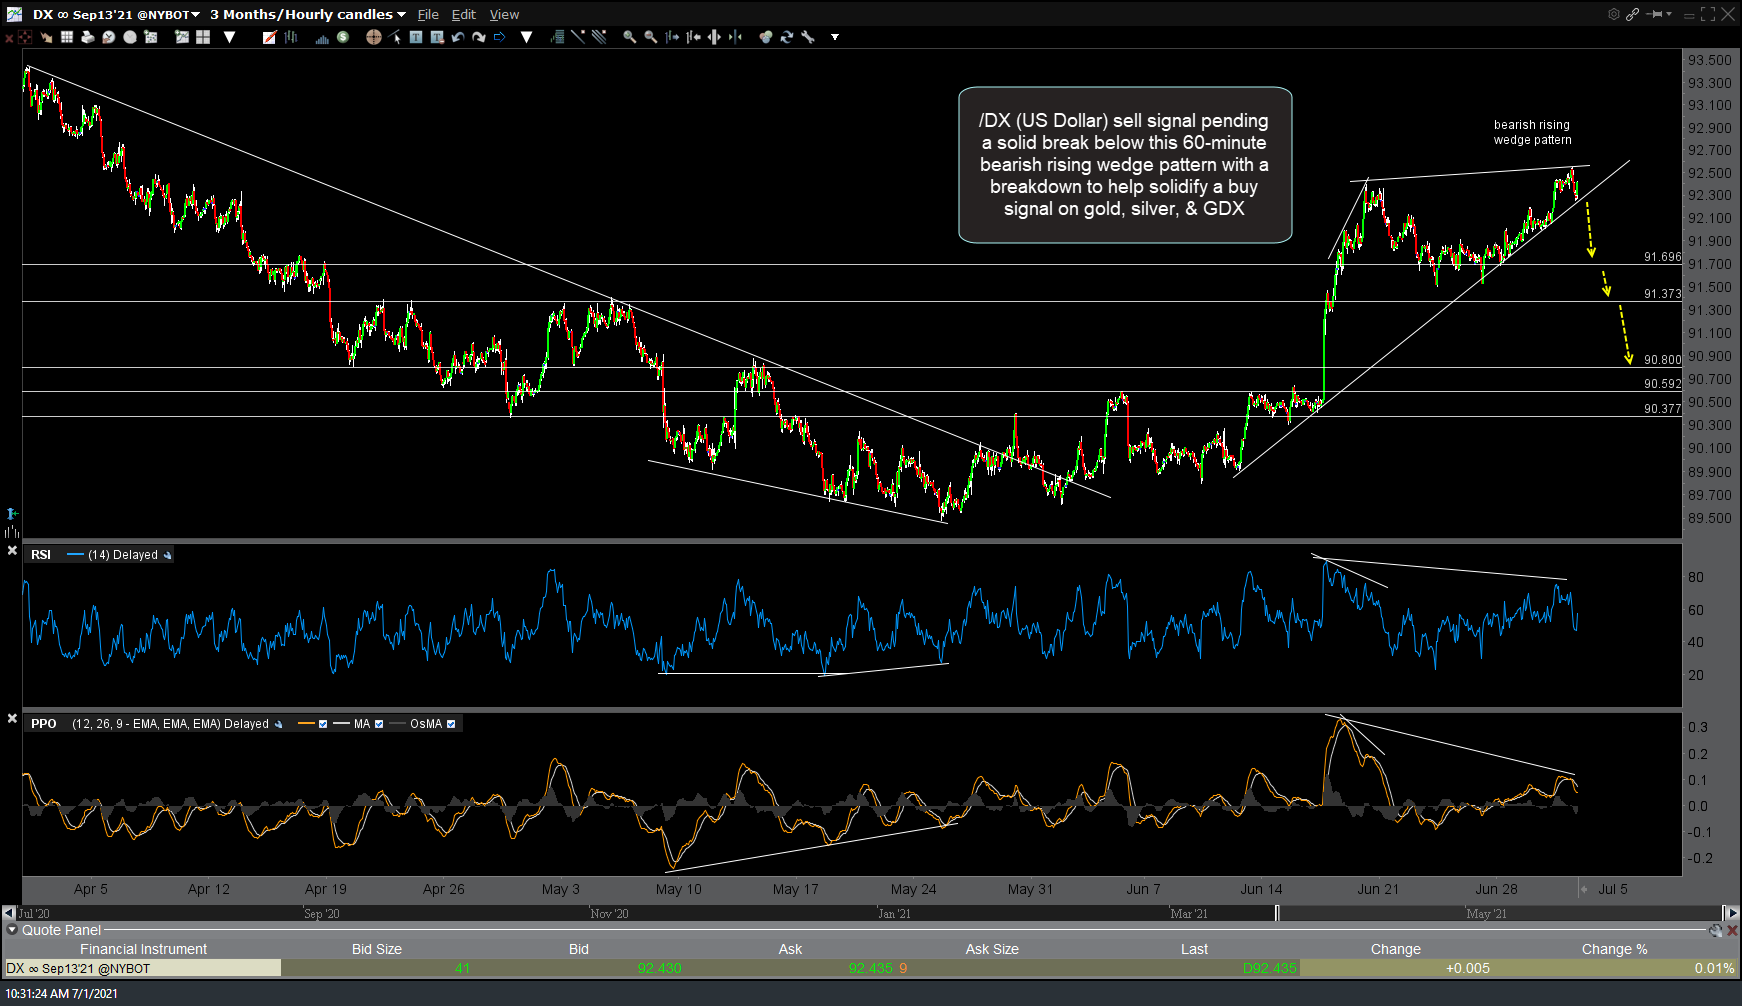
DX 60m July 1st