
After reversing off the top of the buy zone Monday before last, GLD (gold ETF) has now rallied into downtrend line resistance where the odds for a reaction are elevated. If/when the downtrend is clearly taken out, next resistance/target zone runs from roughly 179.34-181.19 while any pullbacks towards the buy zone will still offer objective scale-in entries for long-term positions. Daily chart below.
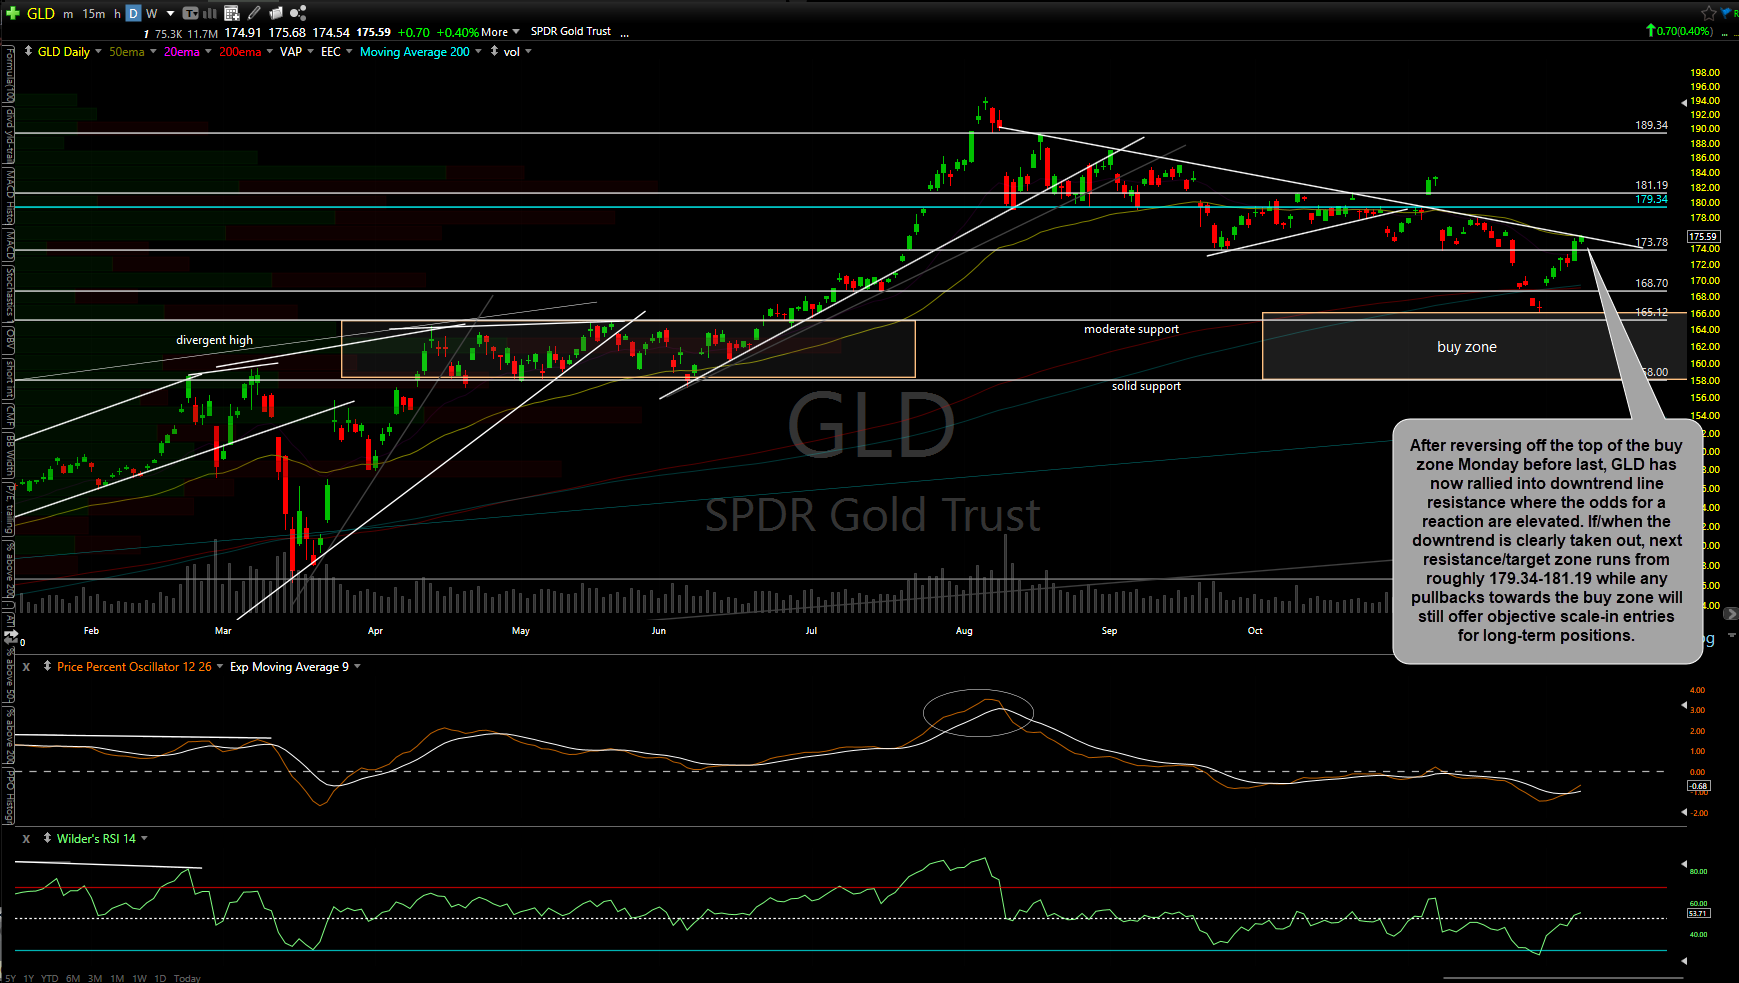
GLD daily Dec 8th
After reversing off the bottom of the Sept – current trading range, SLV (silver ETF) is currently trading in no-man’s land; about 3/4th of the way towards the top of the range with the next buy signal to come on a solid break above. Daily chart below.

SLV daily Dec 8th
EUR/USD has potential (unconfirmed) negative divergences following the recent breakout above the long-term downtrend line as it tests the 1.22ish minor resistance. Should these divergences play out for a correction, a backtest of the trendline would be a likely target (red scenario). Should the divergences get taken out, a continued rally up to the next target around 1.2672 should help bring gold near or above new all-time highs (green scenario, less the minor zigs & zags along the way). The former (red) scenario would be near-term bearish for gold while the latter (green) would be bullish. Weekly & daily charts of $EUR/USD below.

EUR-USD weekly Dec 8th
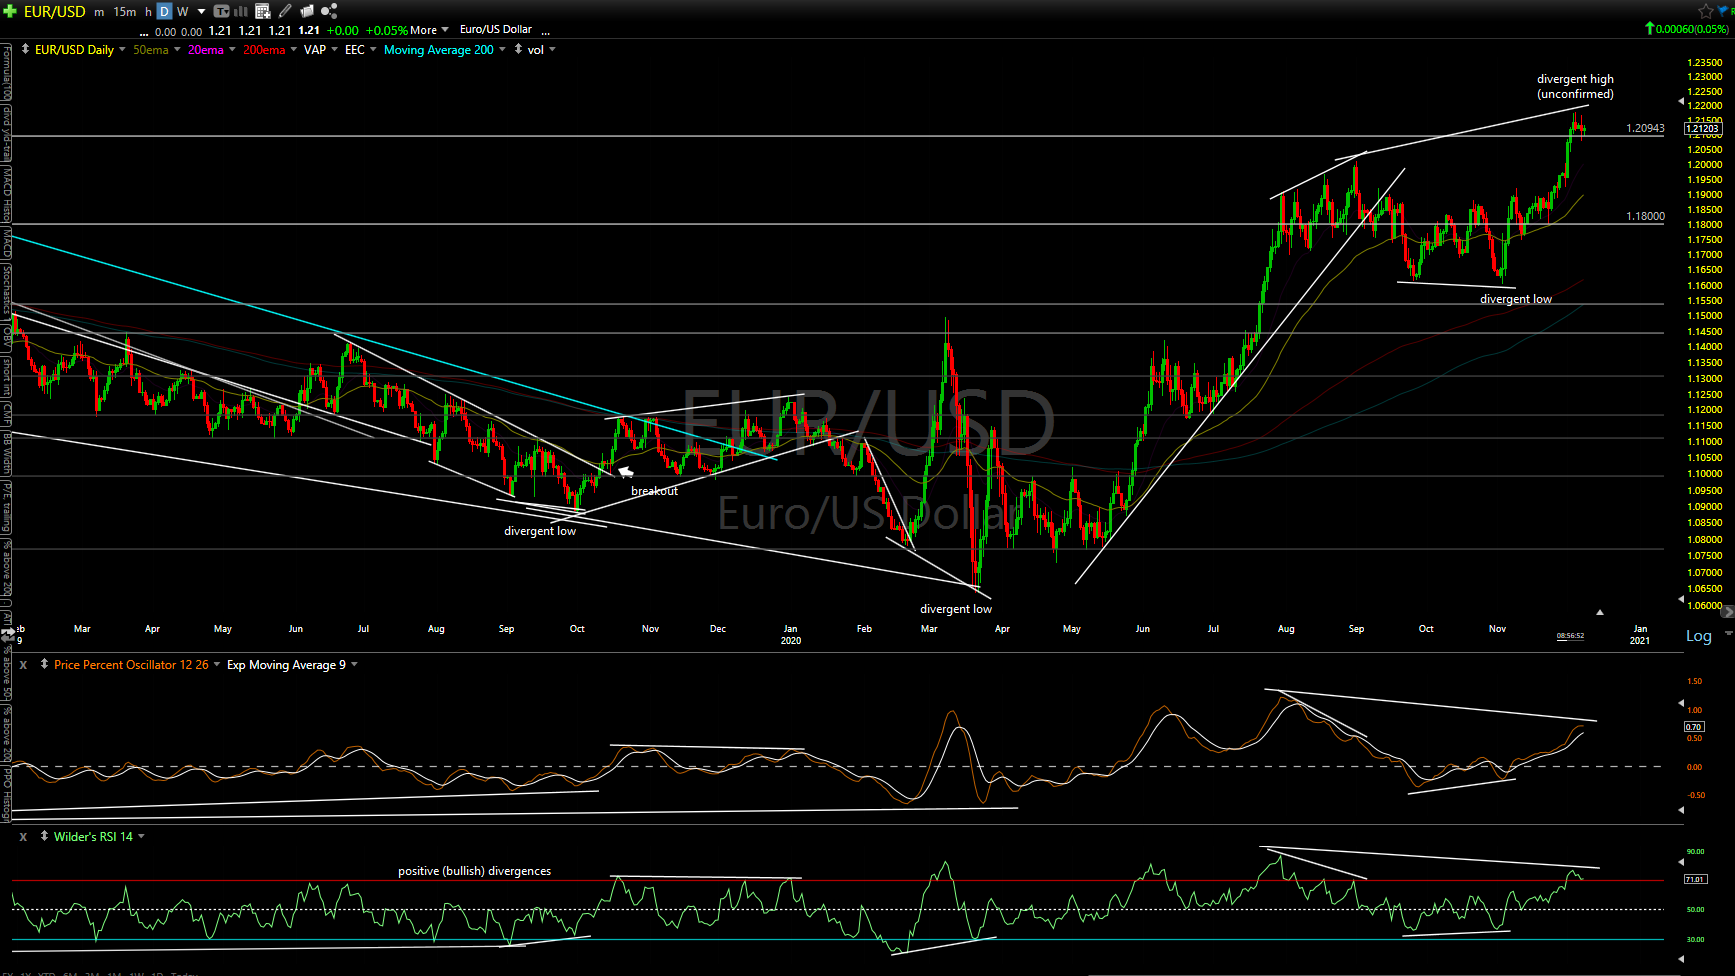
EUR-USD daily Dec 8th