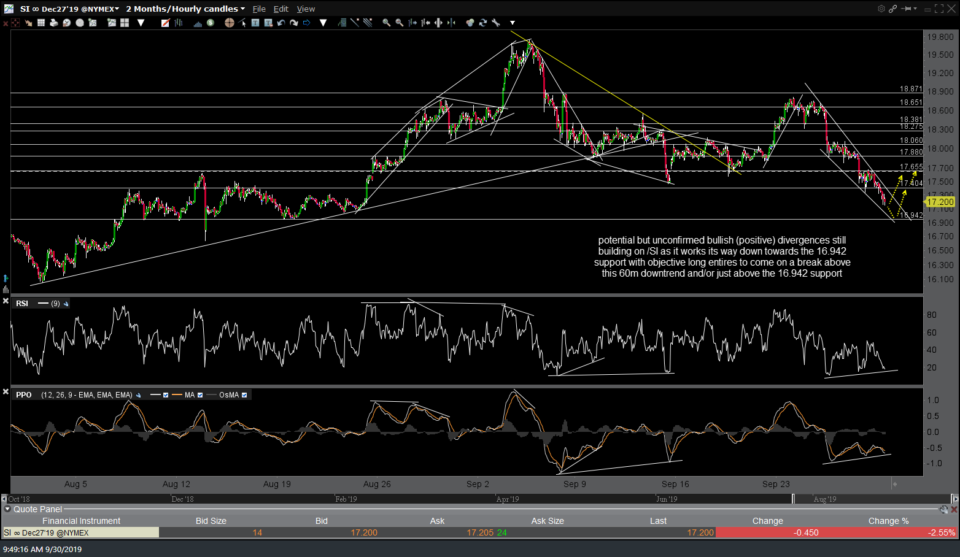
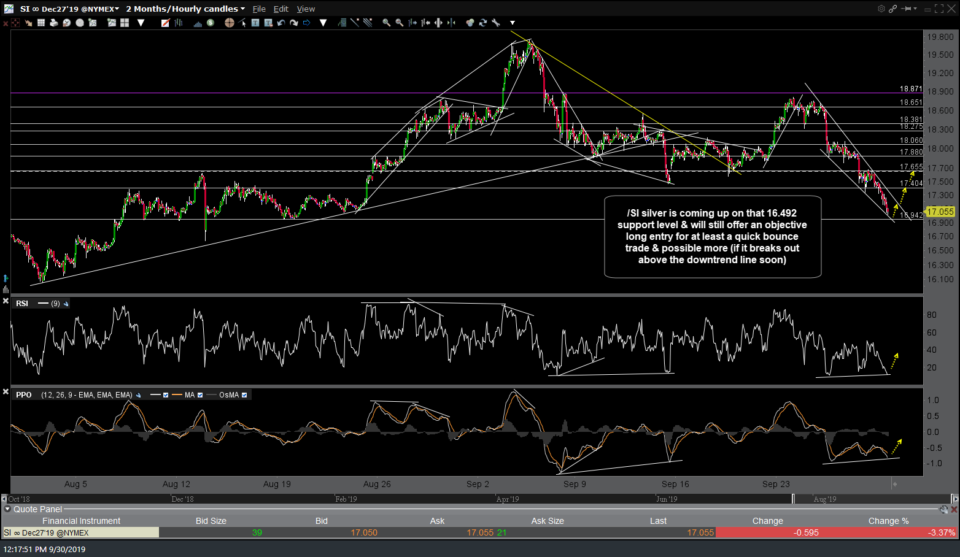
/SI silver is coming up on that 16.492 support level posted earlier (first chart below) & will still offer an objective long entry for at least a quick bounce trade & possible more, should it reverse around this support level & go on to break out above the downtrend line soon assuming that /GC gold also reverses & breaks out above its comparable downtrend line below.
- SI 60m Sept 30th
- SI 60m 2 Sept 30th
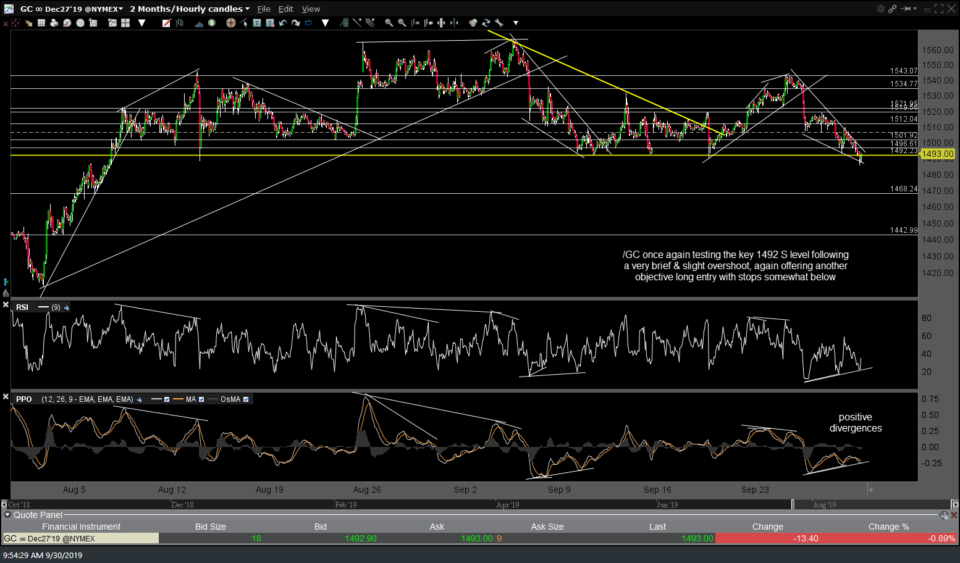
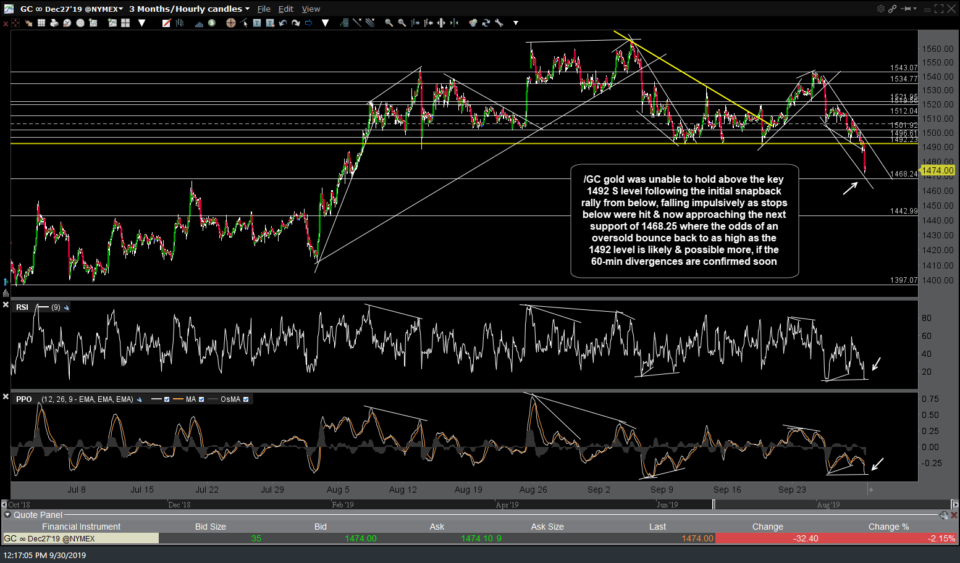
/GC gold was unable to hold above the key 1492 S level following the initial snapback rally from below, falling impulsively as stops below were hit & now approaching the next support of 1468.25 where the odds of an oversold bounce back to as high as the 1492 level is likely & possible more, if the 60-minute positive divergences are confirmed soon via a bullish crossover on the PPO while putting in an equal or higher low vs. the previous reaction low.
- GC 60m Sept 30th
- GC 60m 2 Sept 30th
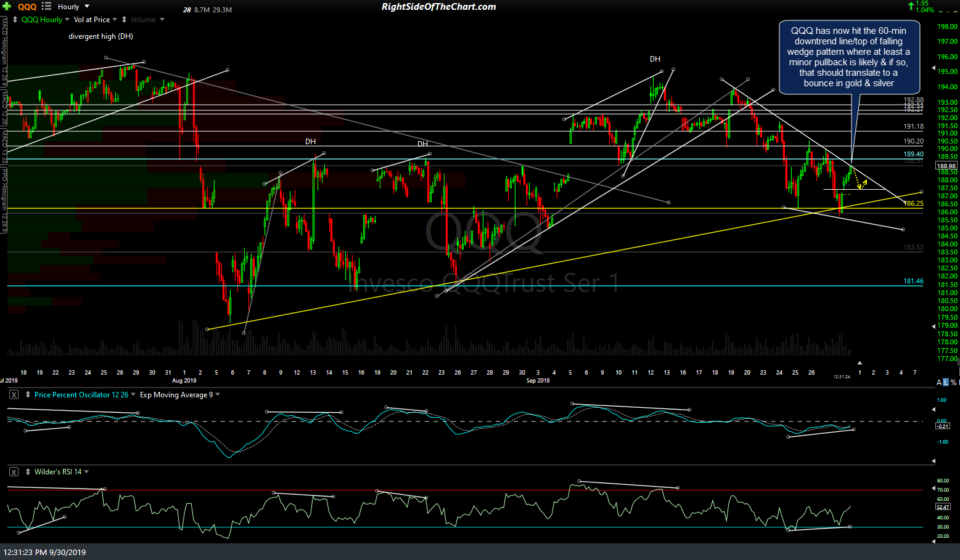
A reversal (bounce) in gold & silver (risk-off assets) would mesh with the scenario of a pullback off the initial tag of the top of the falling wedge/downtrend line on the QQQ 15-minute & 60-minute charts, as outlined in today’s video. As of now, these are only potential trading opportunities for active traders
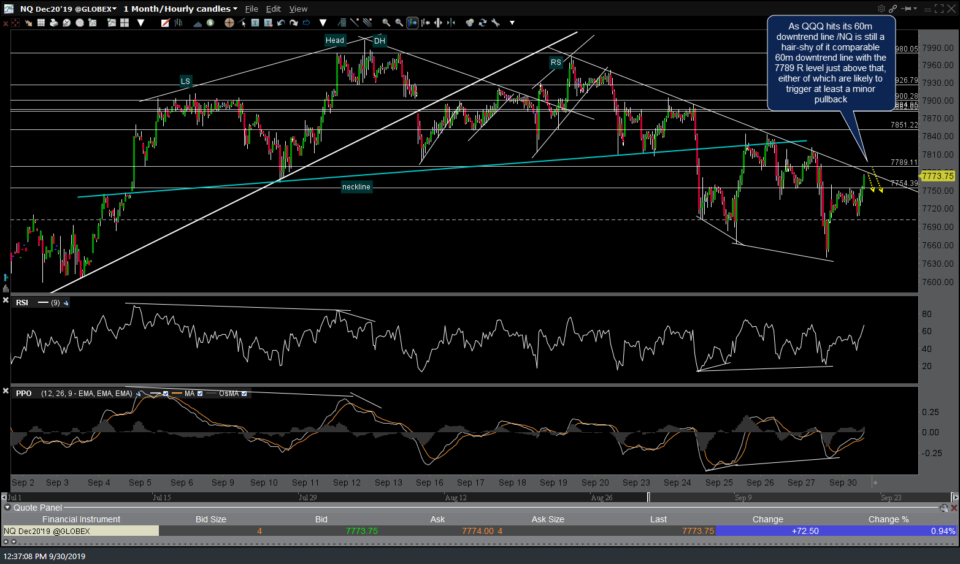
As QQQ hits its 60-minute downtrend line /NQ ($NDX futures) is still a hair-shy of it comparable 60m downtrend line with the 7789 resistance level just above that, either of which are likely to trigger at least a minor pullback.
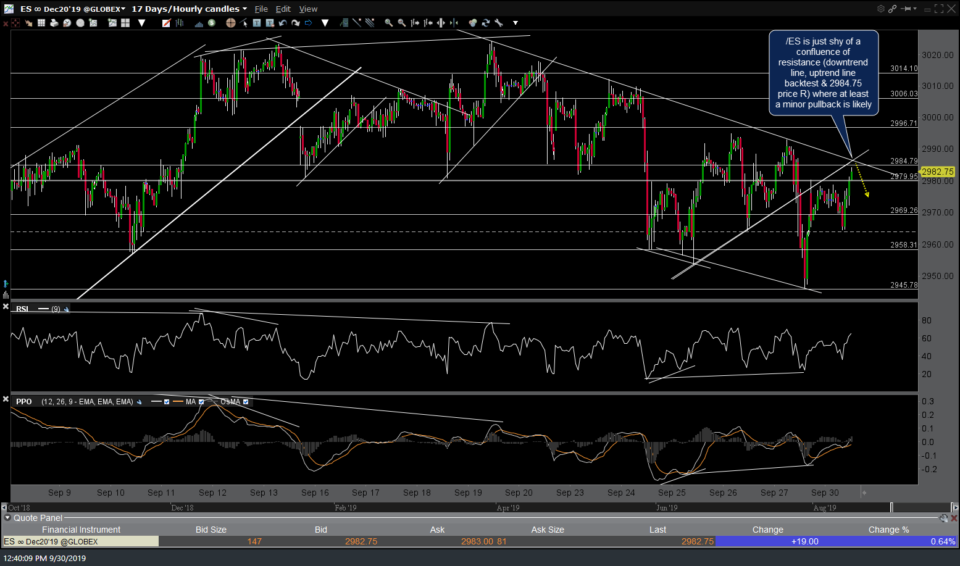
/ES (SPX futures) is just shy of a confluence of resistance levels (downtrend line, uptrend line backtest & 2984.75 price R) on this 60-minute chart where at least a minor pullback is likely. As such, this appears to be an objective level to go long the precious metals & short the stock indexes for either a quick bounce (metals)/pullback (equites) trade or one could let those positions ride while trailing down stops to hold out for a deeper thrust down within the stock index wedges and possibly even a major sell signal on an impulsive break below Friday’s low.
Typical, less-active swing traders & investors might opt to stand aside at this time to see whether the 60-minute bullish falling wedge patterns trigger near-term buy signals via impulsive breakouts or if a longer-term sell signal is triggered soon with impulsive breaks & solid daily closes below Friday’s lows.


