
Despite the recent correction in the Euro/rally in the US Dollar, which has exerted some pressure on Dollar-sensitive assets such as gold, the case for a major top in the US Dollar & bottom in gold is still very much intact for now, although with some work still to be done as outlined below.
This correction, which was foreshadowed by the last September divergent high & trendline break on the EUR/USD 60-minute chart, has brought EUR/USD back to the major support level on the more significant daily time frame with the PPO signal line still indicating a bullish trend (trading above the zero line).

EUR-USD daily Oct 2nd
In additional to falling back down to key support on the daily time frame, EUR/USD has also formed a bullish falling wedge, confirmed with positive divergences, on this 60-minute time frame.
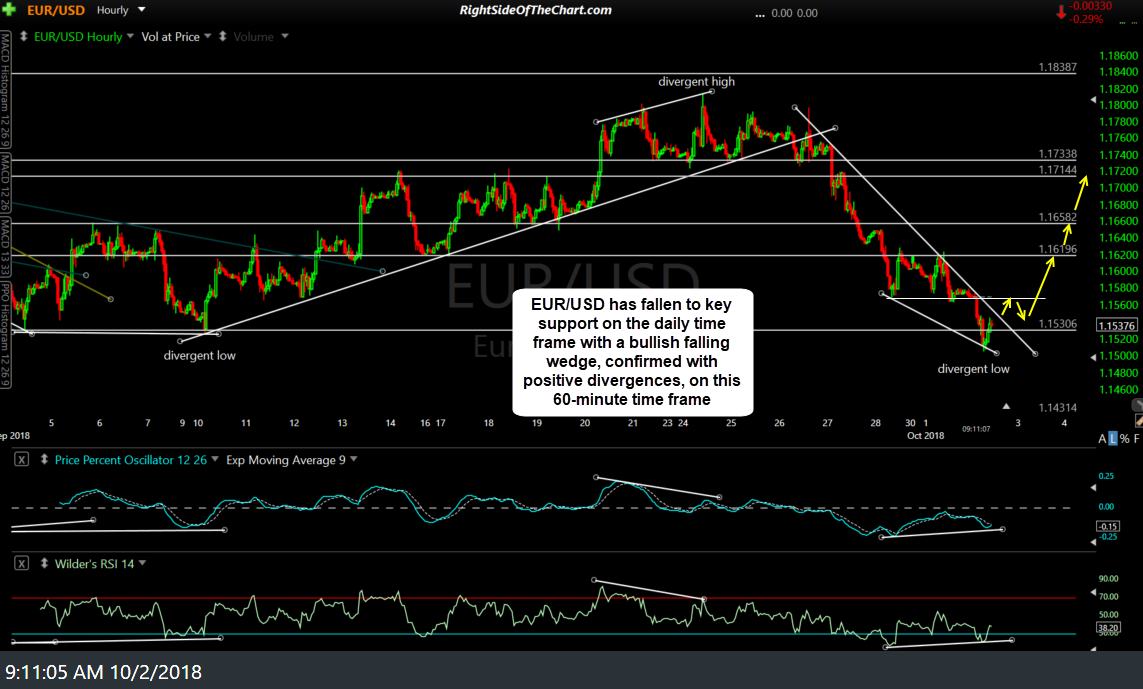
EUR-USD 60-min Oct 2nd
In today’s pre-market session, /GC (gold futures) regained the 1196.62 support/resistance level on an impulsive rally, most likely as savvy traders anticipate a reversal of EUR/USD based on the technical case outlined above. I am still awaiting a breakout above the intersecting 1213 & downtrend line resistance levels for a buy signal on /GC. 60-minute chart below.
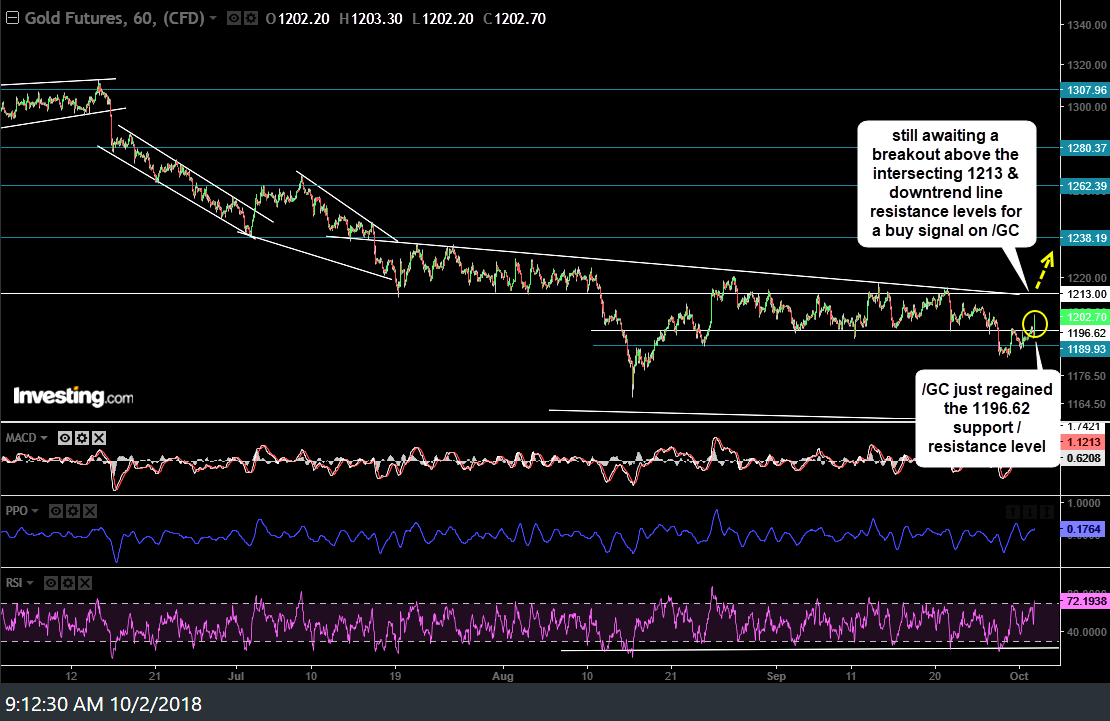
GC 60-min Oct
From the longer-term perspective, I am also awaiting & expecting the a bullish crossover on the PPO of the weekly chart of GLD (gold ETF) following the recent rare oversold reading, similar to the oversold reading & subsequent bullish PPO crossover back in late 2016/early 2017 that came at the start of the sharp 23% rally on GLD.
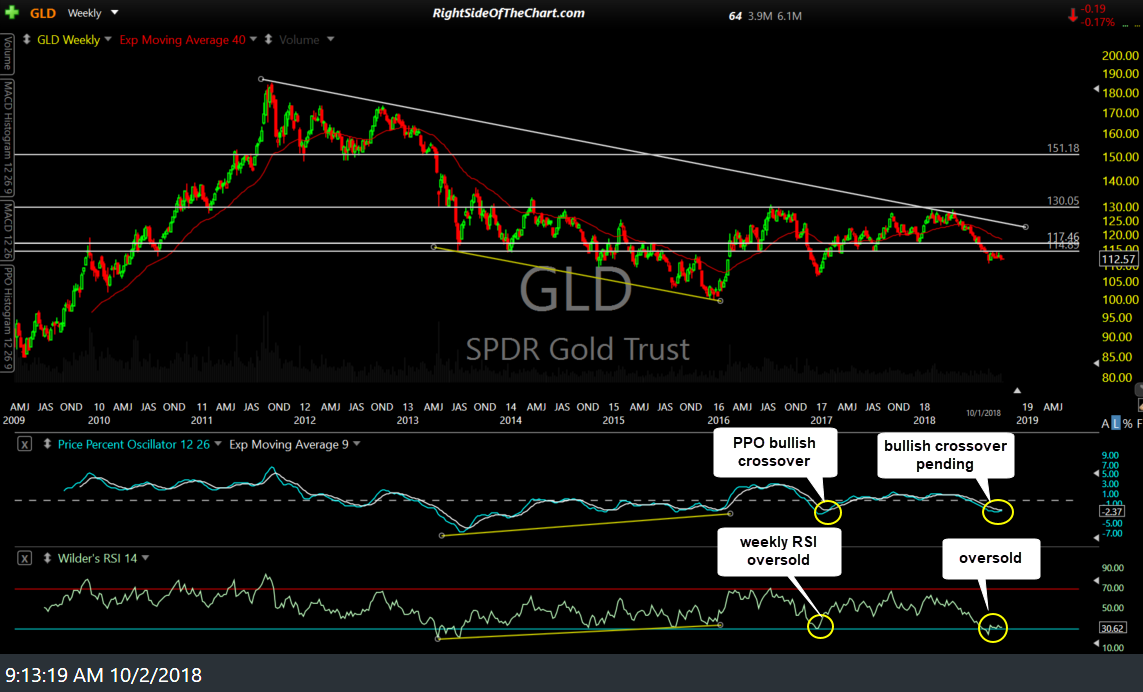
GLD weekly Oct 1st close
The right shoulder of the recently highlighted Inverse Head & Shoulders bottoming pattern continues to develop with GDX now approaching the neckline. In addition to the potential IHS bottoming pattern, GDX also continues to move impulsively higher following the divergent low + breakout & successful backtest of the downtrend line.
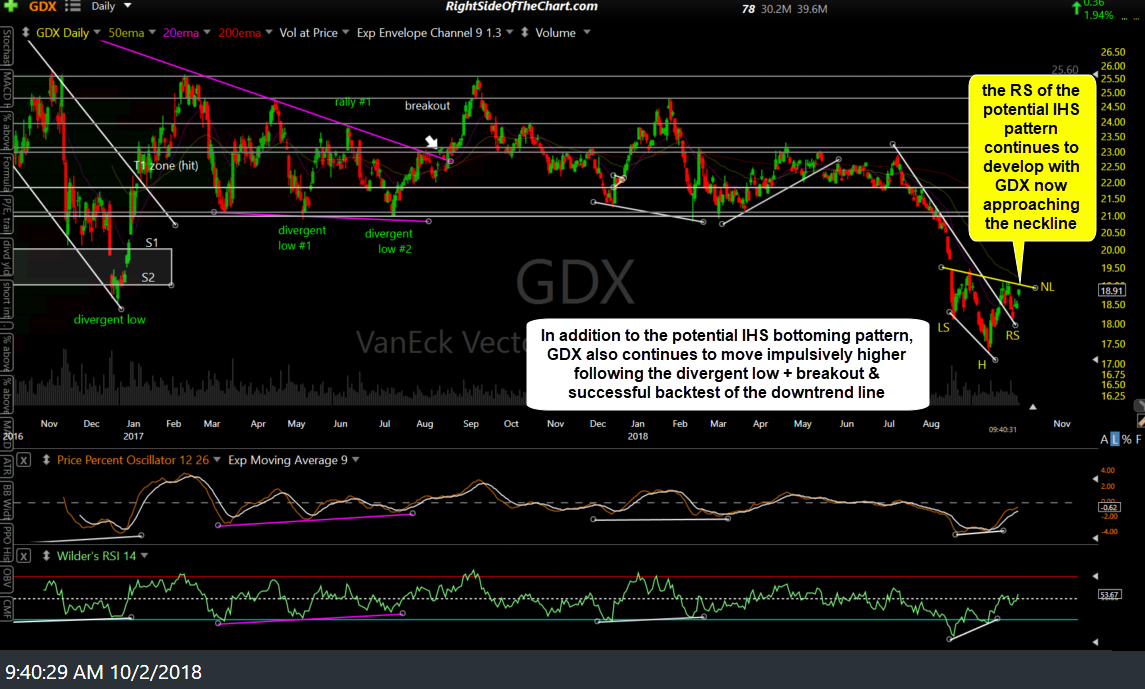
GDX daily Oct 2nd