
Following the December 23rd breakout above the symmetrical triangle pattern & subsequent impulsive rally, GLD has been consolidating around the 147 resistance level (early Sept major reaction high) which I view as bullish for now as that helps to alleviate the overbought conditions & pave the way for the next leg higher. As such, an impulsive break above the Jan 8th high could be the catalyst for the next rally in gold. As noted on the RSI towards the bottom of the chart, nothing goes straight up forever. Even in a bullish trend, securities will usually consolidate following extreme overbought conditions before the next leg higher similar to what gold did back in July of last year following comparable extreme overbought conditions (RSI reading of 85+).
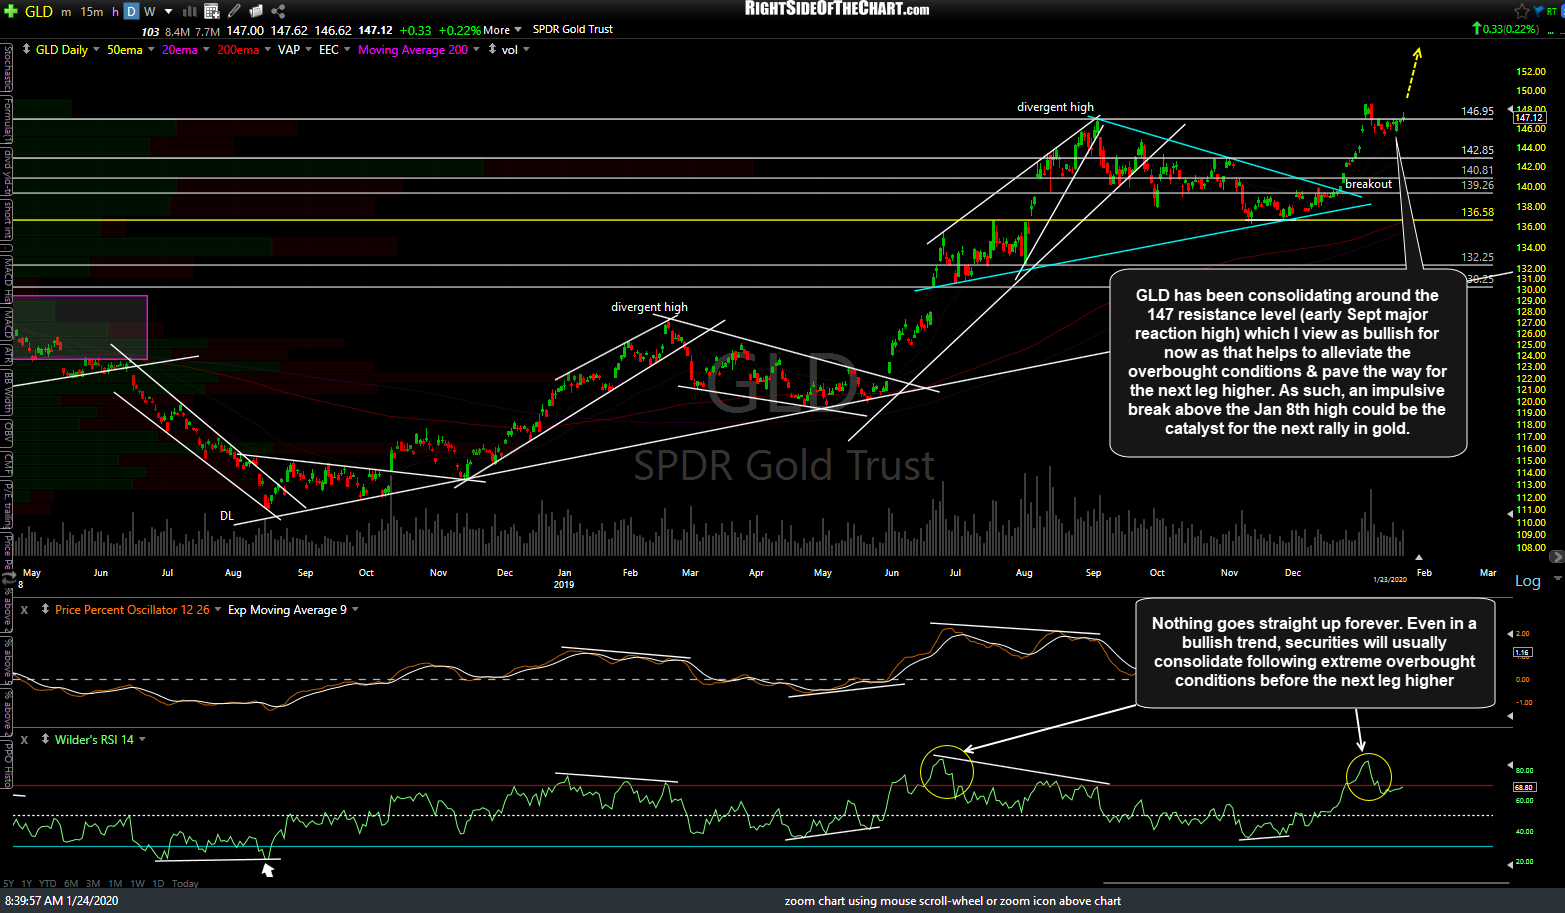
GLD daily Jan 24th
In addition to the recent overbought conditions coupled with the rally into resistance on gold, another headwind for gold has been the recent rise in the US Dollar (which translates into a fall in the Euro) as gold typically has an inverse correlation to the US Dollar ($USD up = gold down & vice versa). EUR/USD (Euro/$USD forex pair) recently broke down below the uptrend line off the Oct 1st divergent low which was & still is near-term bearish. However, as of now, the intermediate-term trend remains bullish with EUR/USD making a series of higher highs & higher lows since the Oct 1st low. Ideally, to keep that uptrend & the longer-term bullish case for EUR/USD (and bearish outlook for $USD) intact, EUR/USD should reverse on or before the 1.099ish support somewhat below current levels, which is my preferred (most likely) scenario at this time.

EUR-USD daily Jan 24th
On the daily chart below, /E7 (Euro futures) recently broke below & backtested the uptrend line off the Oct 1st low & has now fallen to the 1.1061-1.1072ish support zone which is likely to cap the correction & start the next leg higher. If so, that would be bearish for the US Dollar & net bullish for gold. The Euro is, by far, the largest component of the US Dollar index at a weighting of 57.6%, hence the reason a rising Euro = a falling Dollar & vice versa.

E7 daily Jan 24th
Zooming down to the 60-minute time frame, there is what I refer to as ‘potential’ positive divergence as /E7 falls to the 1.1060ish support with the divergence to be ‘confirmed’ via a bullish crossover on the PPO to put in a higher low.
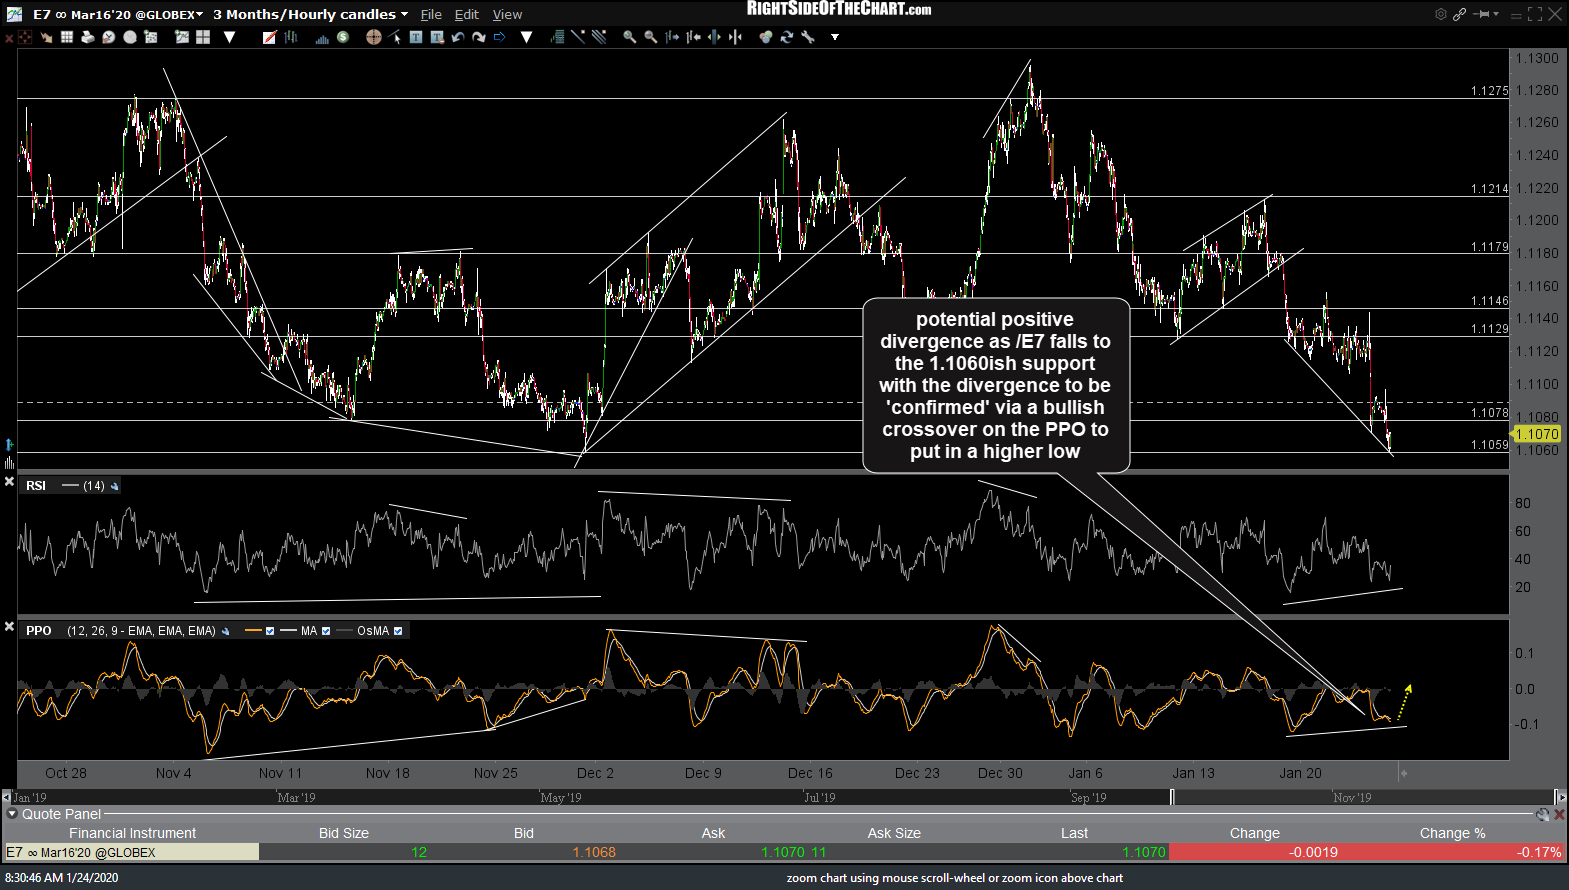
E7 60m Jan 24th
Another one to keep an eye on is the daily chart of the US Dollar ETN, UUP. Following the breakdown below the primary uptrend line, which triggered a major sell signal in the US Dollar, UUP hit & reversed off the 25.89 support level & appears to be bear flagging or at least trading in a price channel with the next sell signals to come on 1) a solid break below the channel and 2) a solid break & close below 25.89.
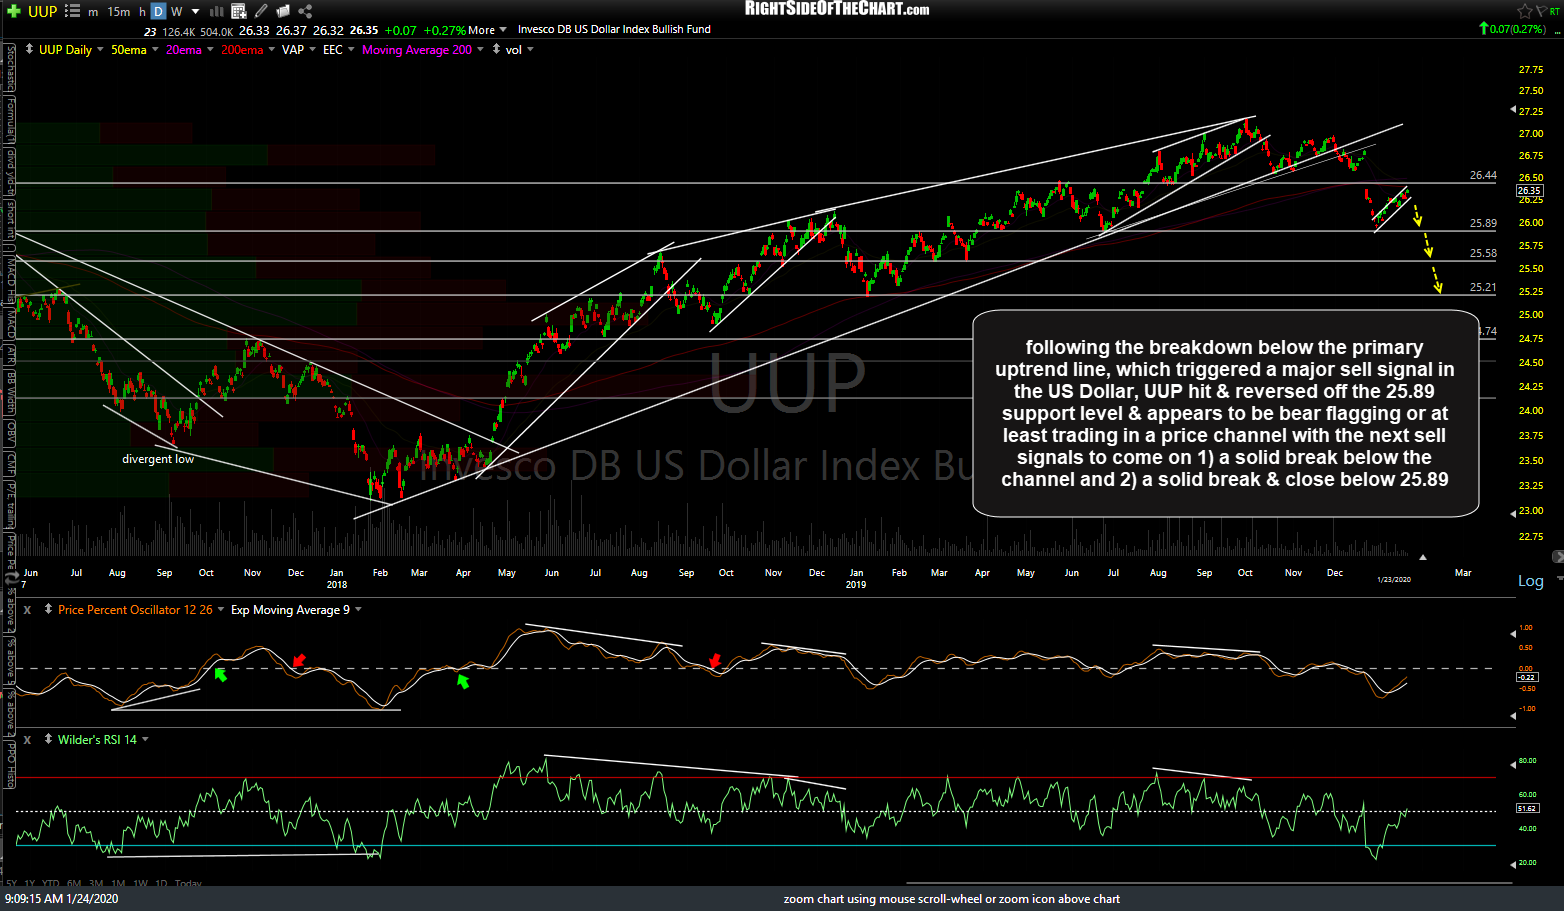
UUP daily Jan 24th