
Yesterday saw the pullback in the broad markets that I was expecting & that selling has so far carried over into the pre-market session today, with the Q’s currently trading around the 101 level. As mentioned in the trading room yesterday, one possible scenario would be that we are in the “B wave down” of an A-B-C corrective pattern following the recent major leg down. This 30-minute chart highlights the Feb 16/17th gap just below current levels which would be a likely pivot point, should the Q’s reverse today and resume moving higher, at least into the close today as I’d expect. I posted closing a good part of my long exposure before the close on Wednesday & my plan today will be to add some of that exposure back today, ideally from around the top of that gap (100.72 area down towards the bottom (99.80) area. However, I will likely close those trades out by the end of the day as I’m just looking for that one last thrust up as today is options expiration (OpEx). (Actually, the Q’s printed 100.90 in pre-market which is close enough for me to start scaling back into some longs).
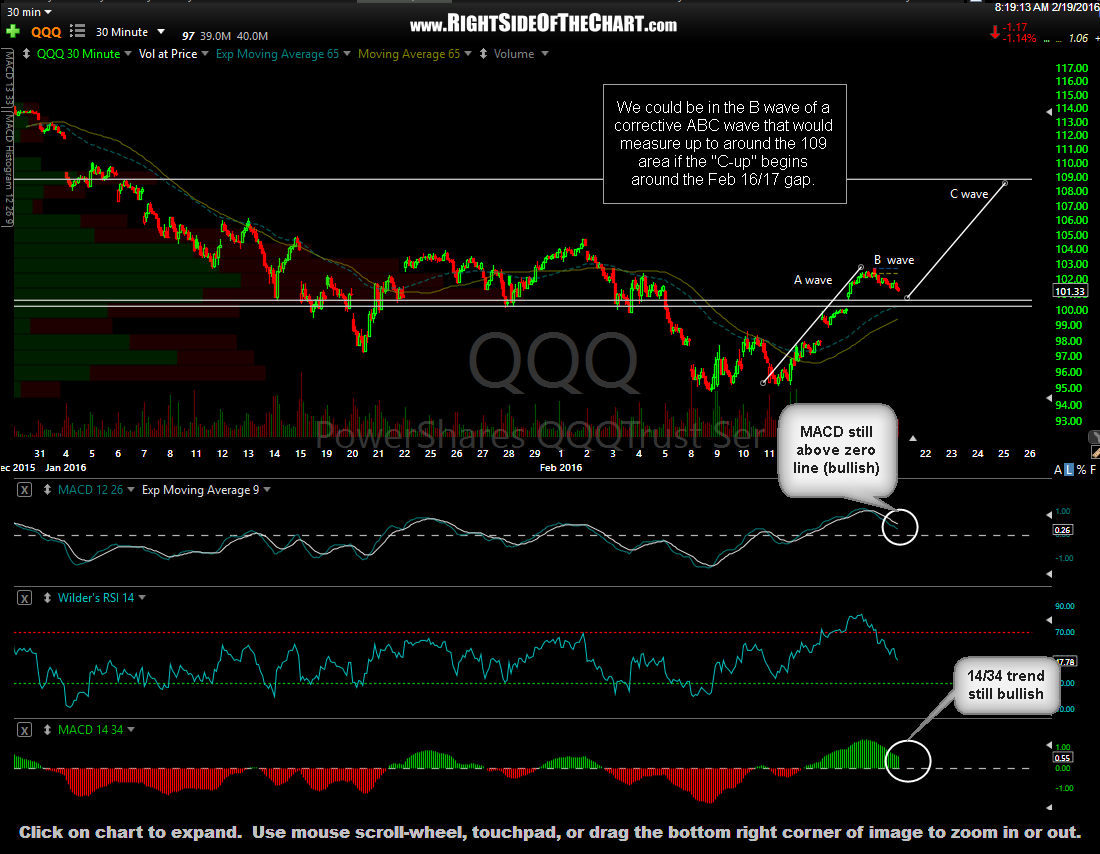
QQQ 30-minute Feb 19th