
Buy signals on /NQ (Nasdaq 100 futures) and QQQ to come on a solid break above this bullish falling wedge pattern as well as a recovery back above the yellow uptrend line. 120-minute chart of /NQ below.
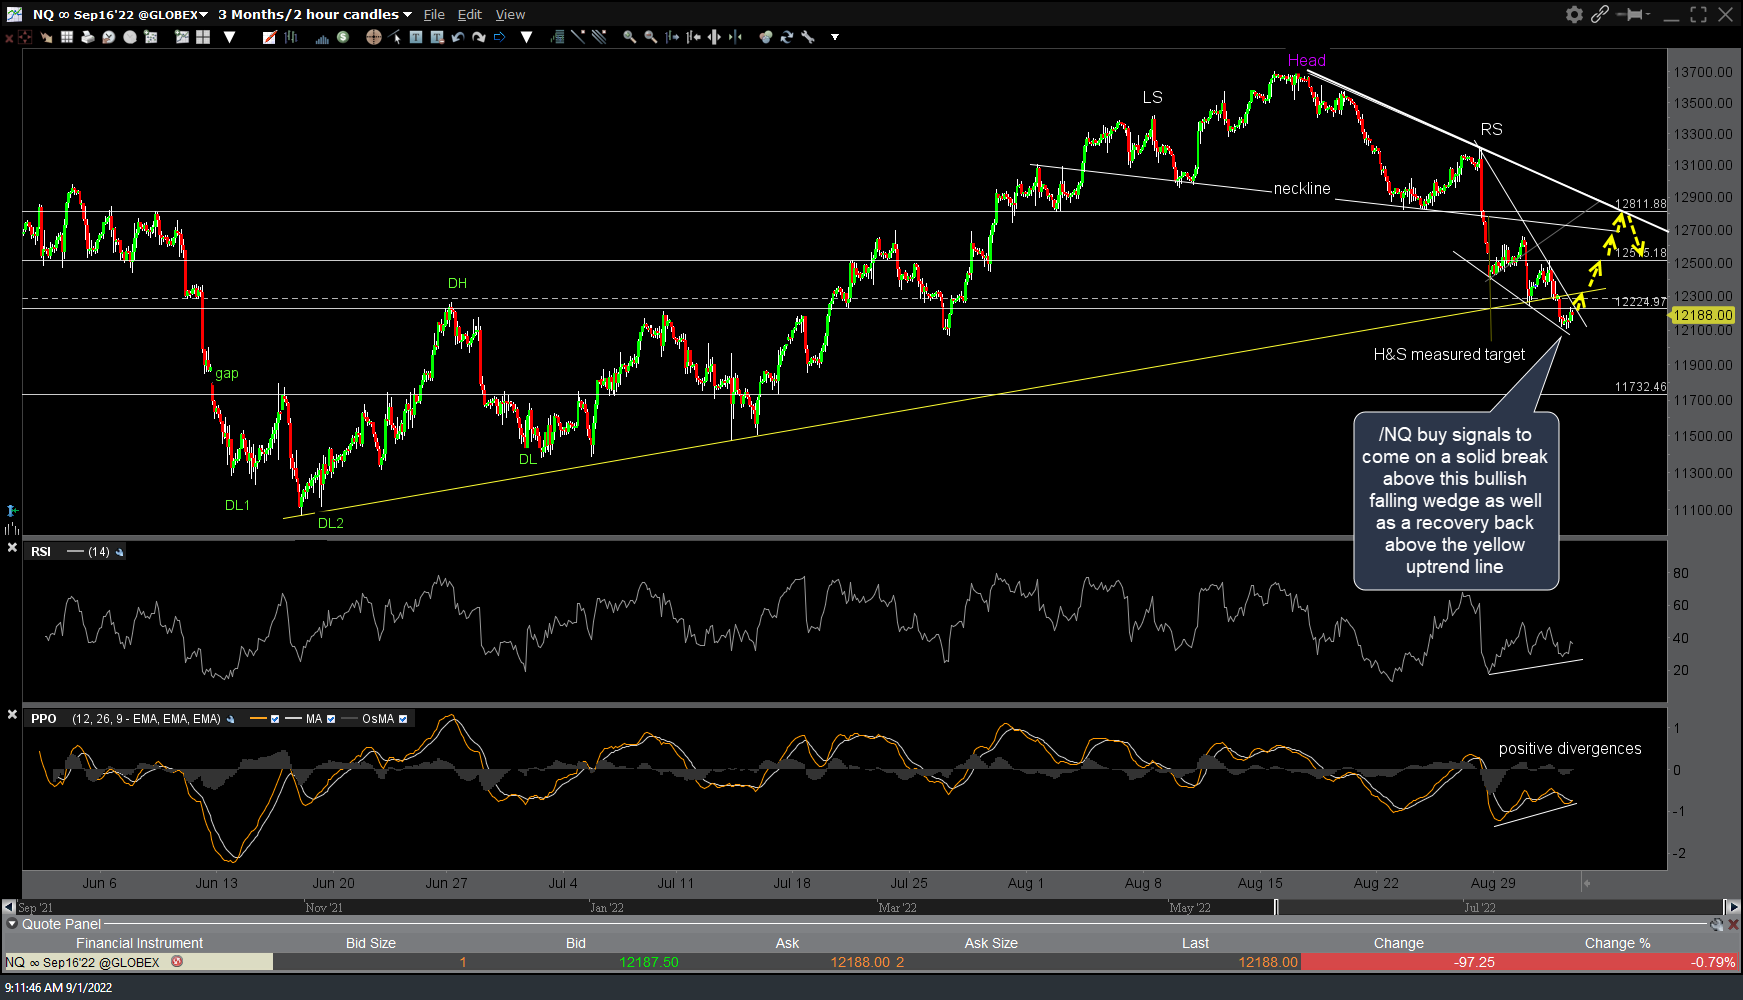
NQ 120m Sept 1st
Likewise, /ES (S&P 500) and SPY will offer objective long entries on either a slight drop down to the 3911 price support & intersecting primary uptrend line support and/or a solid breakout above this bullish falling wedge pattern. Arrow breaks on both charts denote levels where a reaction is likely upon the initial tag with a current max. bounce target of those downtrend lines off the recent highs. Even if only trading the $NDX or $SPX, ideally you want to see both clearly break out above their respective wedge patterns to minimize the chance of a whipsaw (false) buy signal on either.

ES 120m Sept 1st