As an update to last Thursday’s QQQ & Leading FAAMG Stocks Analysis post, below are the previous & updated 60-minute charts (120-min on AAPL) in descending order of market cap, along with the near-term outlook for each of these market leading stocks. The scenarios outlined below hinge largely on the preferred scenario outlined in the Stock Market Analysis video posted earlier today, including a failure on the recent breakouts in XLF (financial sector ETF) and IWM (Russell 2000 Small Cap Index ETF), either of which has yet to occur.
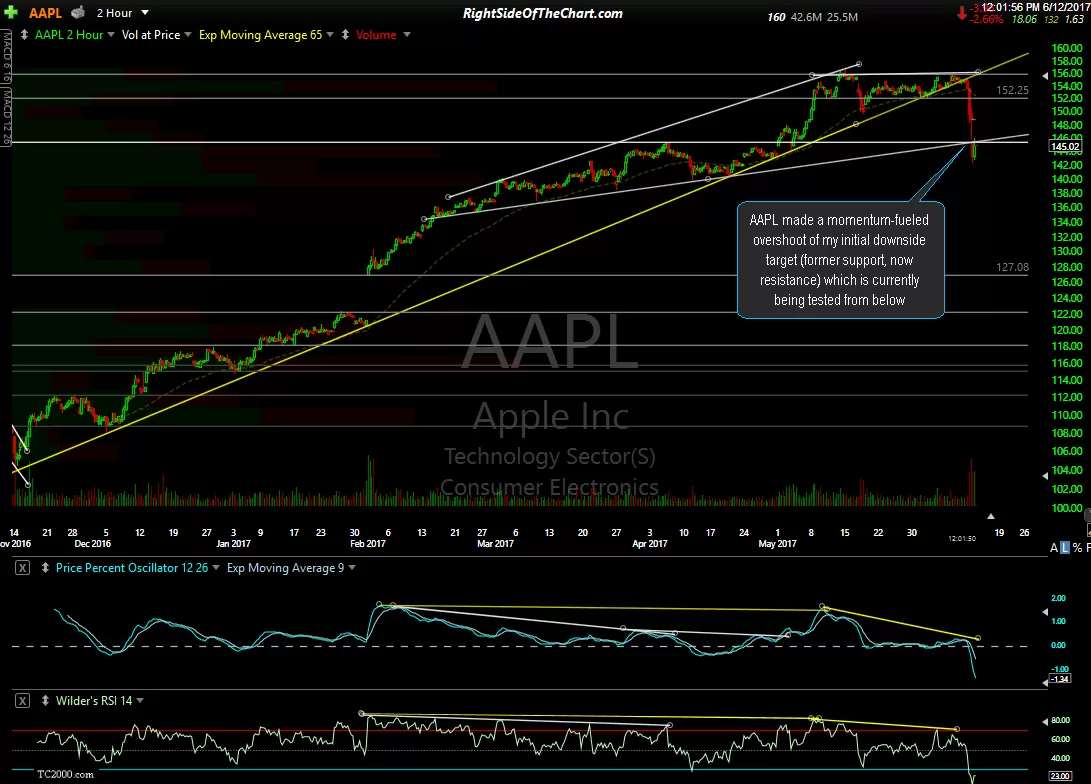
AAPL (Apple Inc.) made a momentum-fueled overshoot of my initial downside target (former support, now resistance) which is currently being tested from below. Should AAPL fail to regain that level, a move down to the 127 area is likely.
-
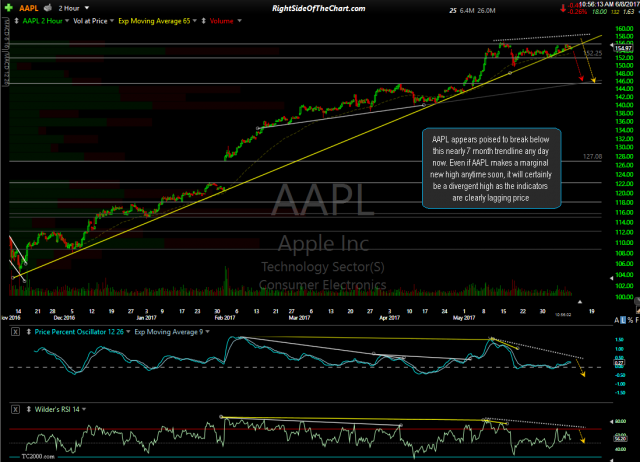
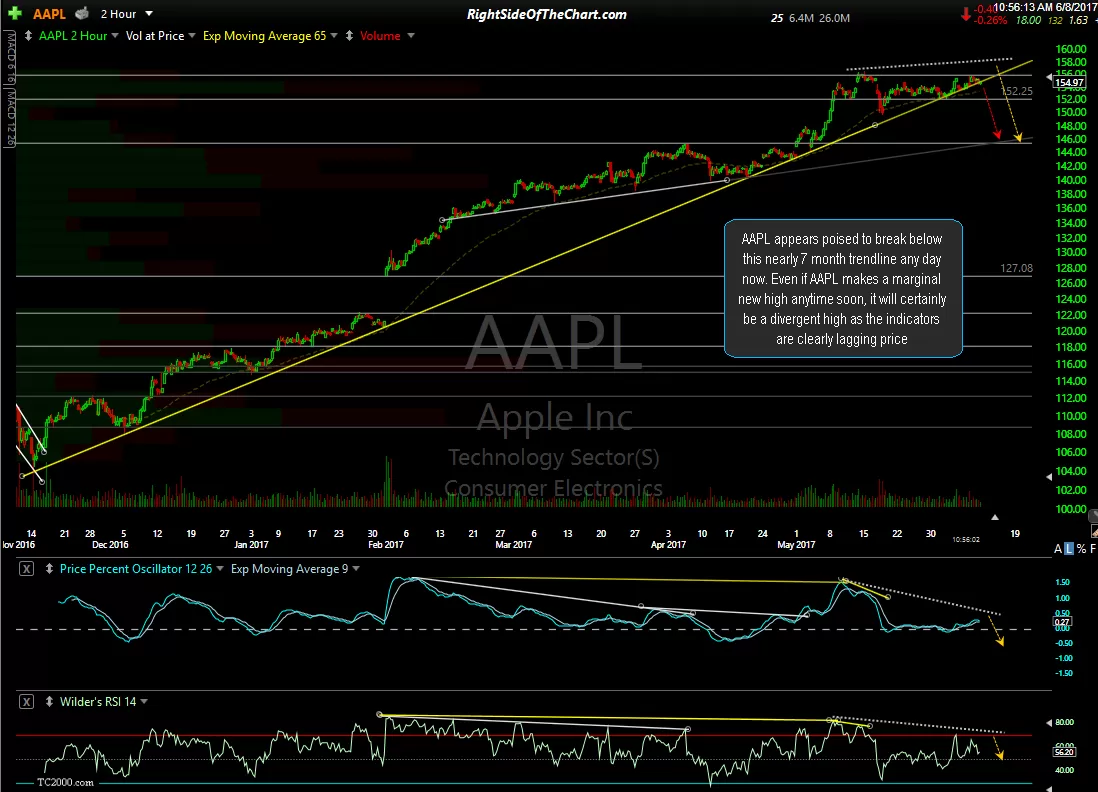
- AAPL 120-minute June 8th
-
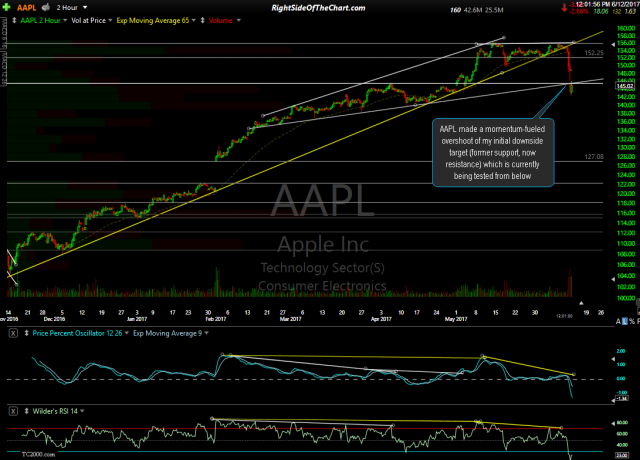
- AAPL 120-minute June 12th
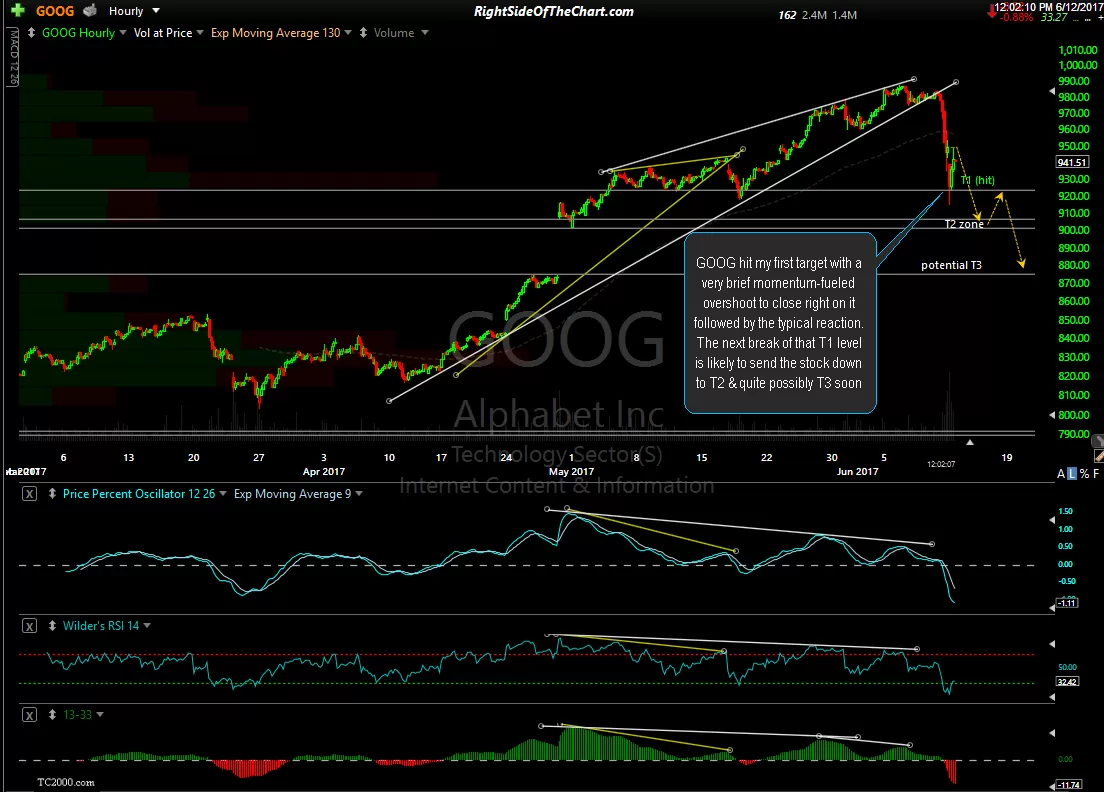
GOOG (Alphabet Inc.) hit my first target with a very brief momentum-fueled overshoot to close right on it followed by the typical reaction. The next break of that T1 level is likely to send the stock down to T2 & quite possibly T3 soon.
-
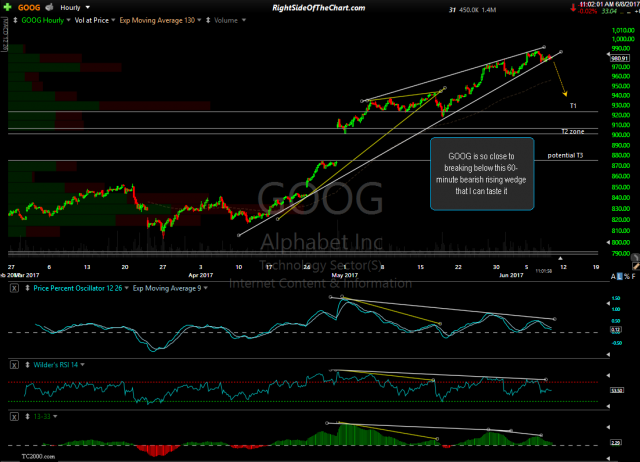
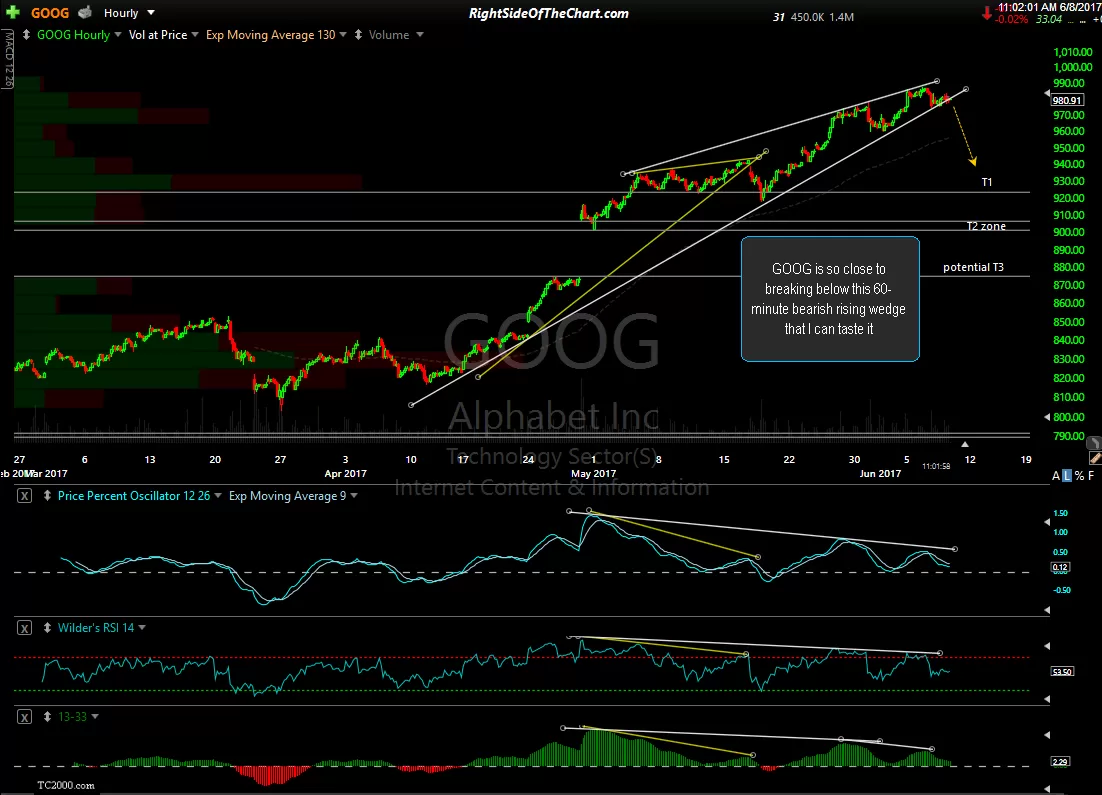
- GOOG 60-minute June 8th
-
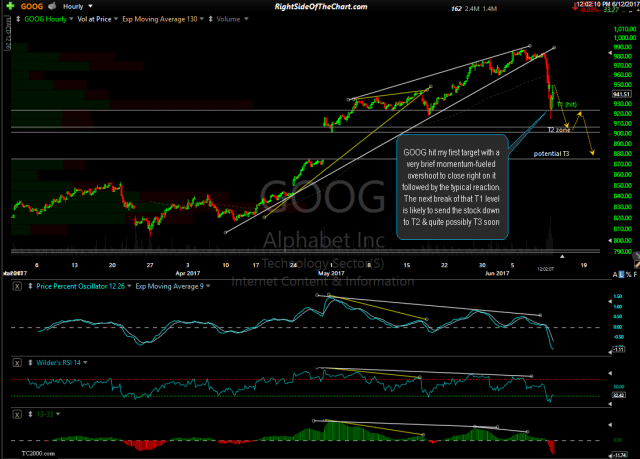
- GOOG 60-minute June 12th
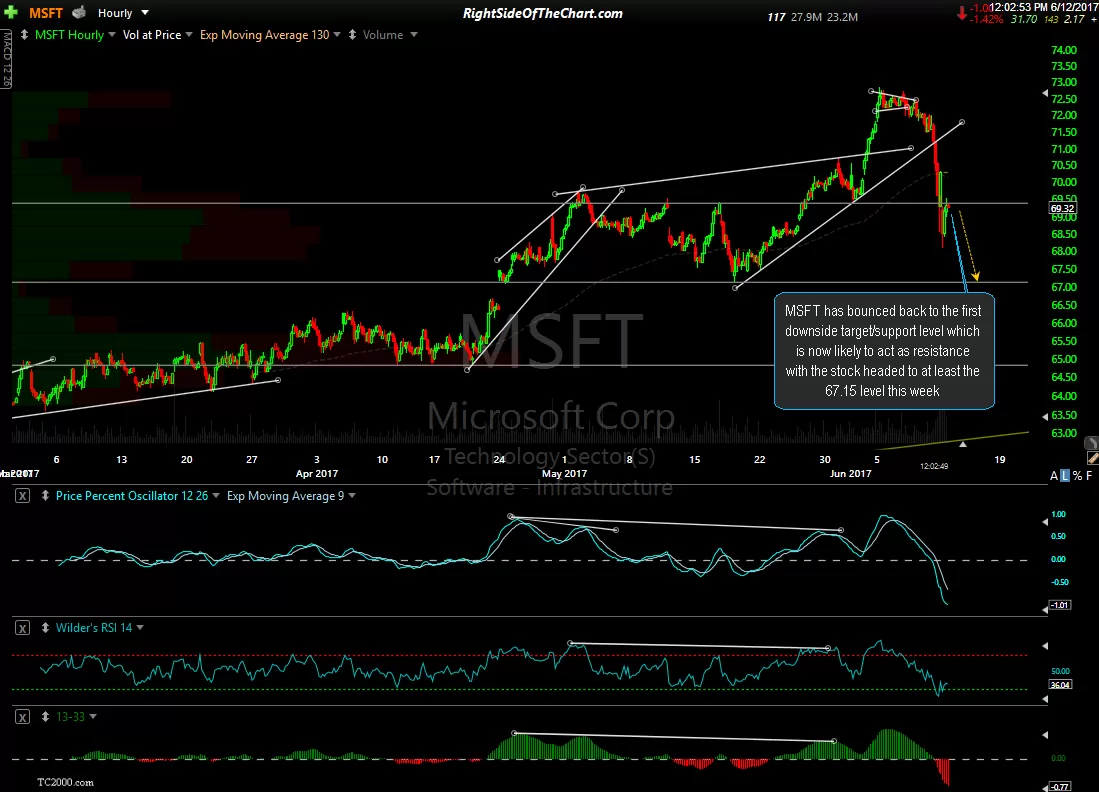
MSFT (Microsoft Inc.) has bounced back to the first downside target/support level which is now likely to act as resistance with the stock headed to at least the 67.15 level this week.
-
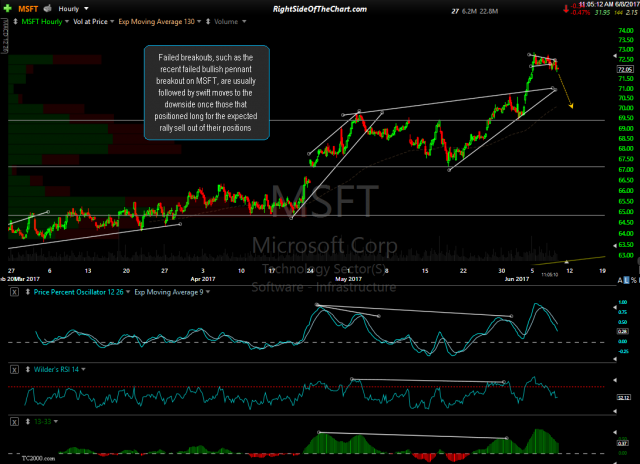
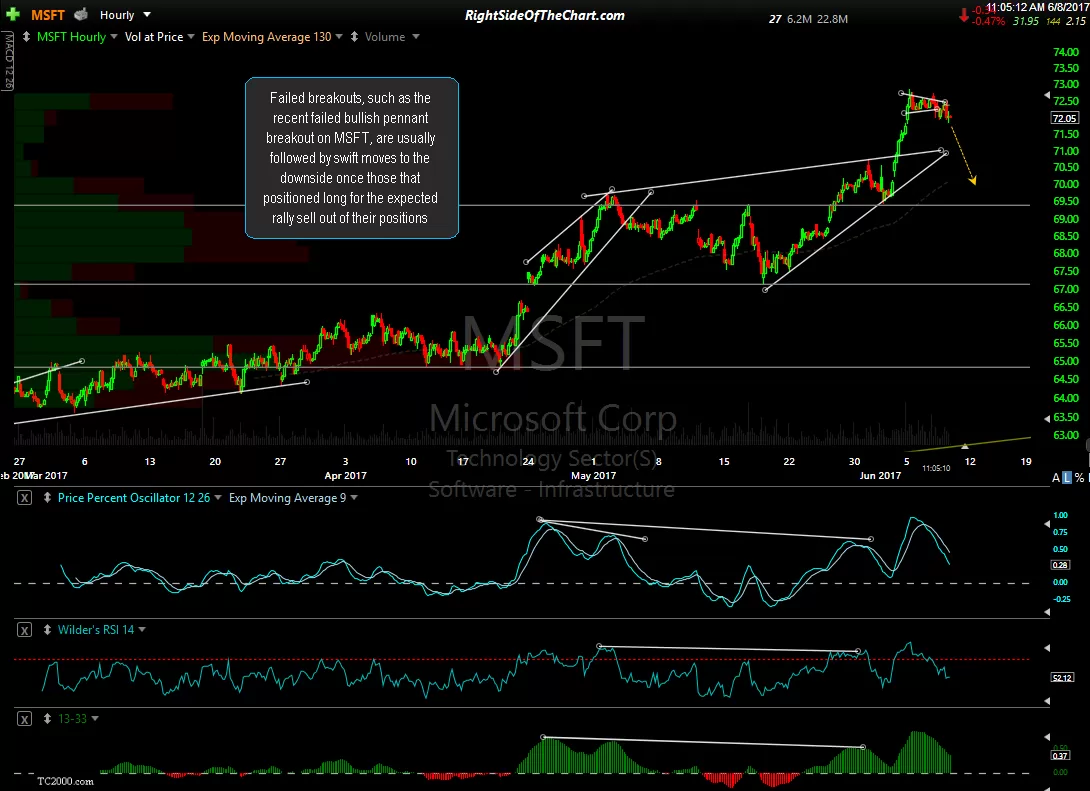
- MSFT 60-minute June 8th
-
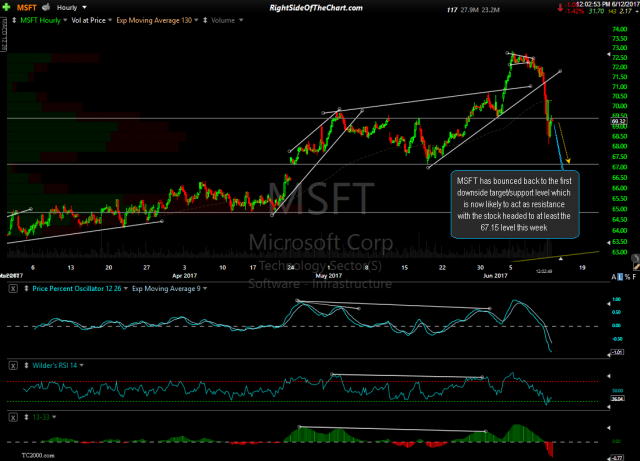
- MSFT 60-minute June 12th
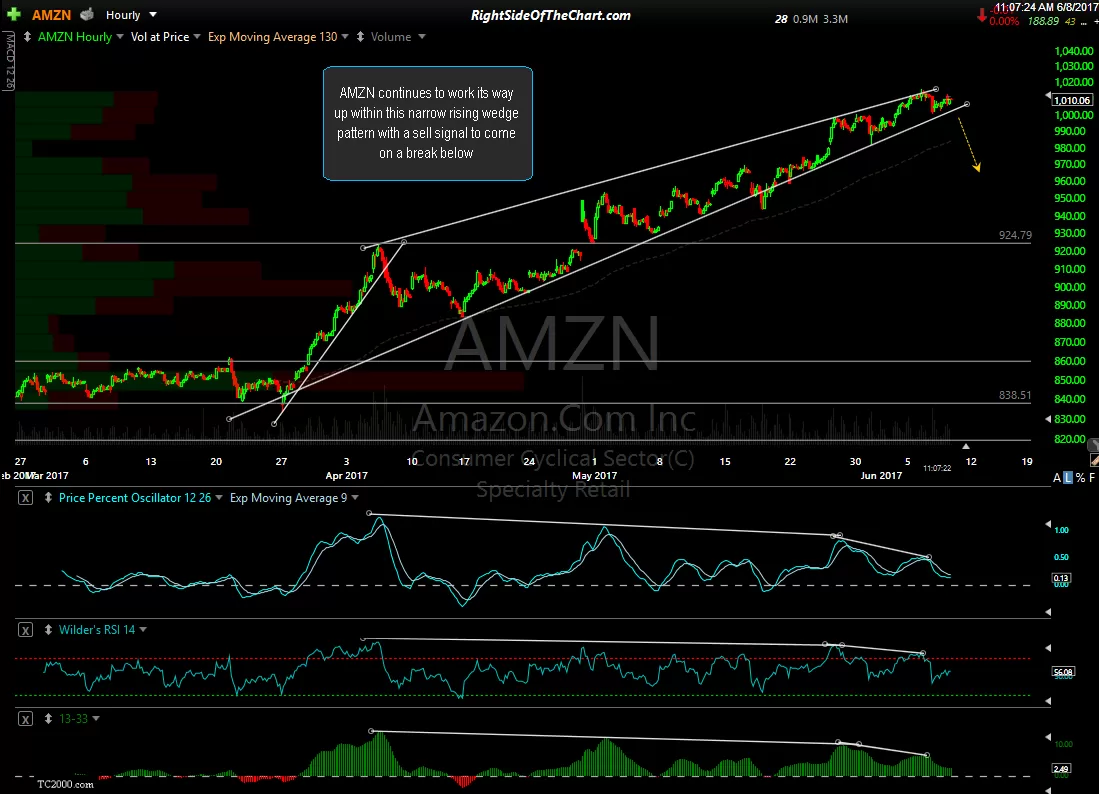
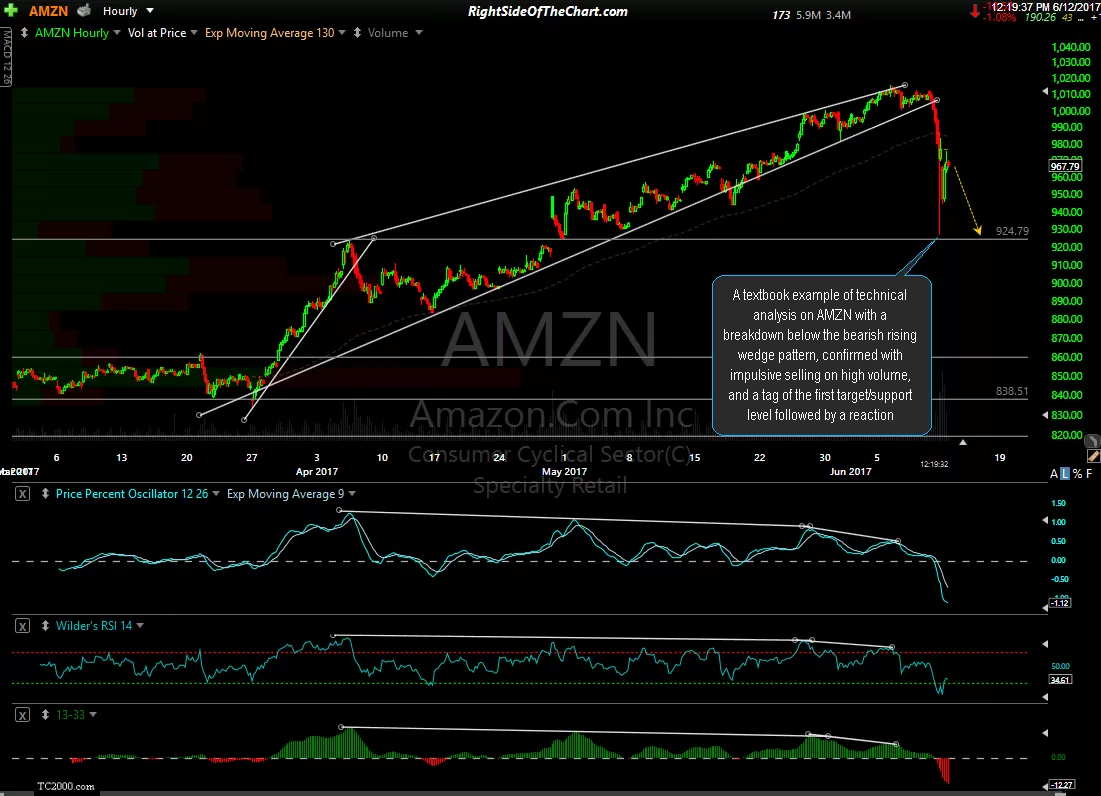
A textbook example of technical analysis on AMZN (Amazon.com Inc.) with a breakdown below the bearish rising wedge pattern, confirmed with impulsive selling on high volume, and a tag of the first target/support level followed by a reaction.
-
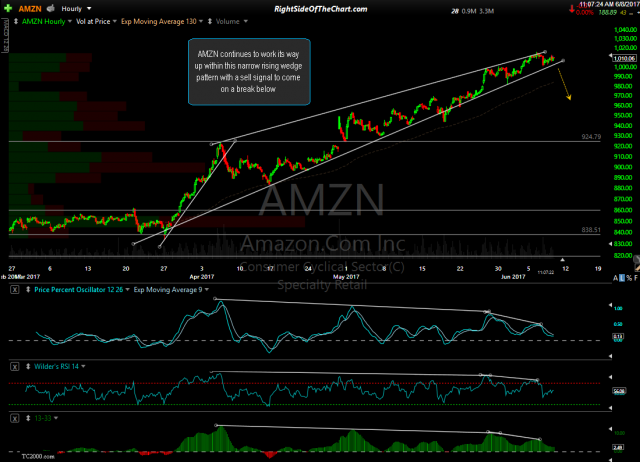
- AMZN 60-minute June 8th
-
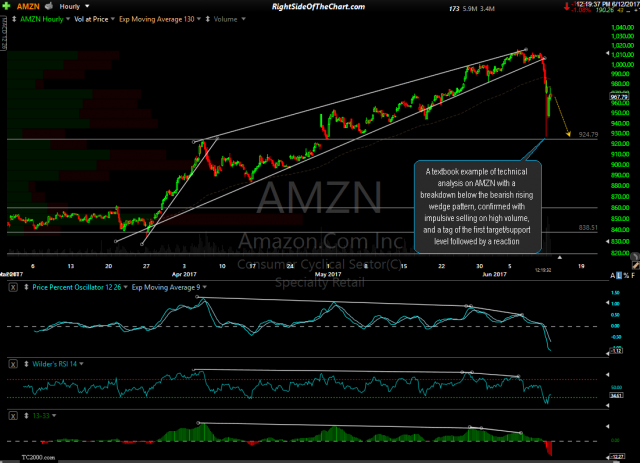
- AMZN 60-minute June 12th
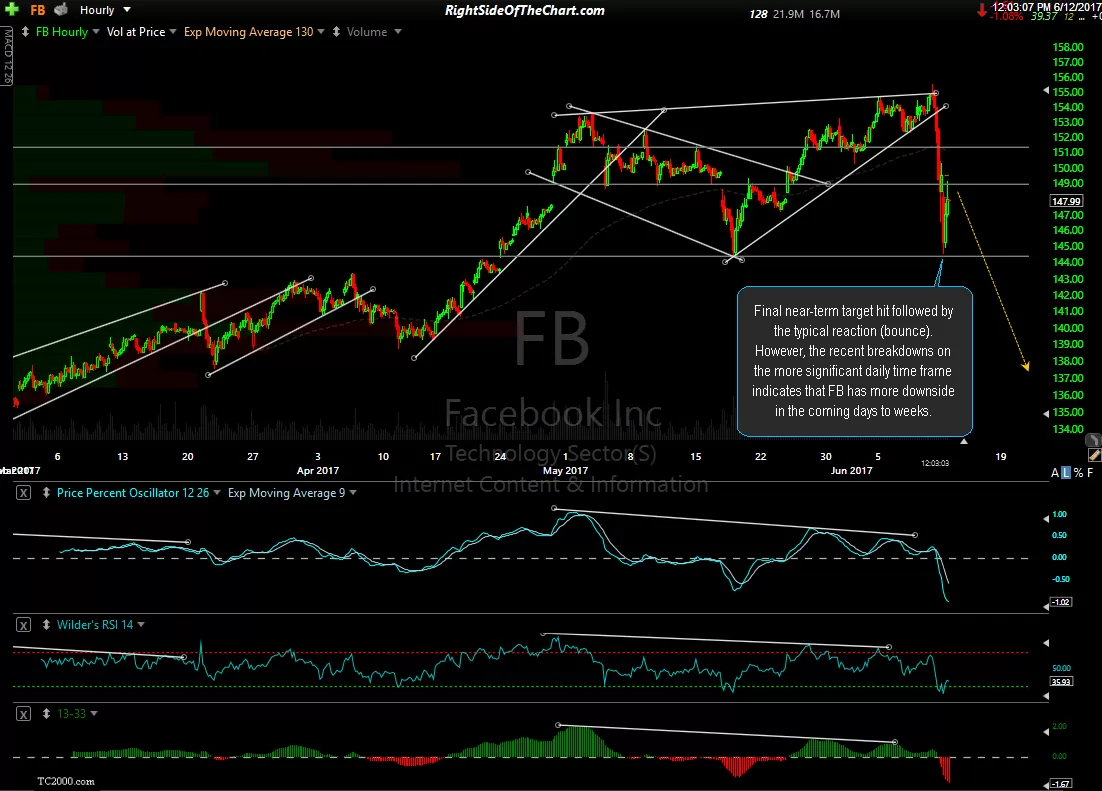
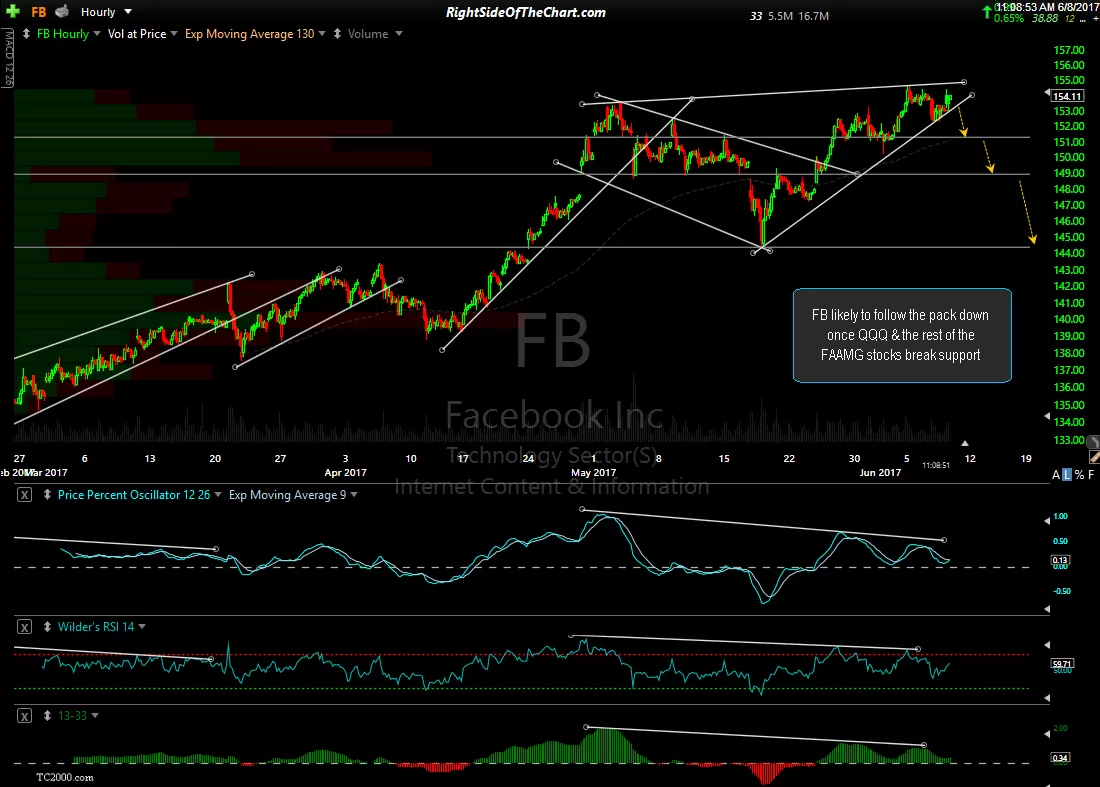
Final near-term target hit followed by the typical reaction (bounce) on FB (Facebook Inc.). However, the recent breakdowns on the more significant daily time frame indicates that the stock has more downside in the coming days to weeks.
-
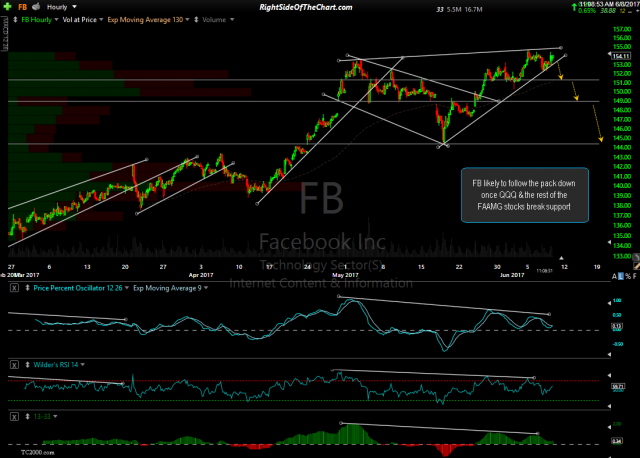
- FB 60-minute June 8th
-
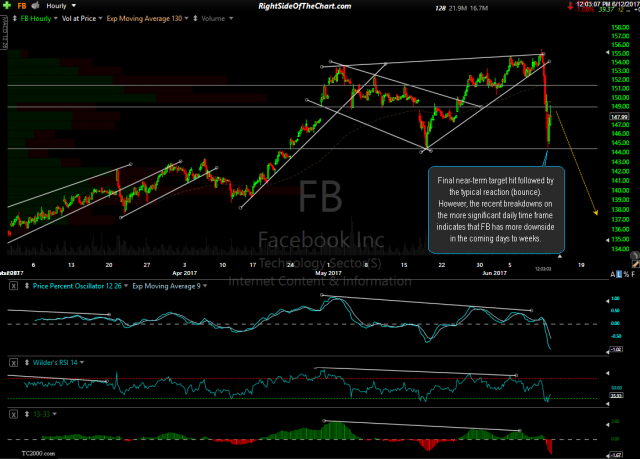
- FB 60-minute June 12th