
Today’s rally in the stock market continues the unusual disparity between the normally tight correlation between the Euro & the S&P 500 which typically doesn’t last very long with either one or the other likely to play catch-up soon (Euro up or SPY down).
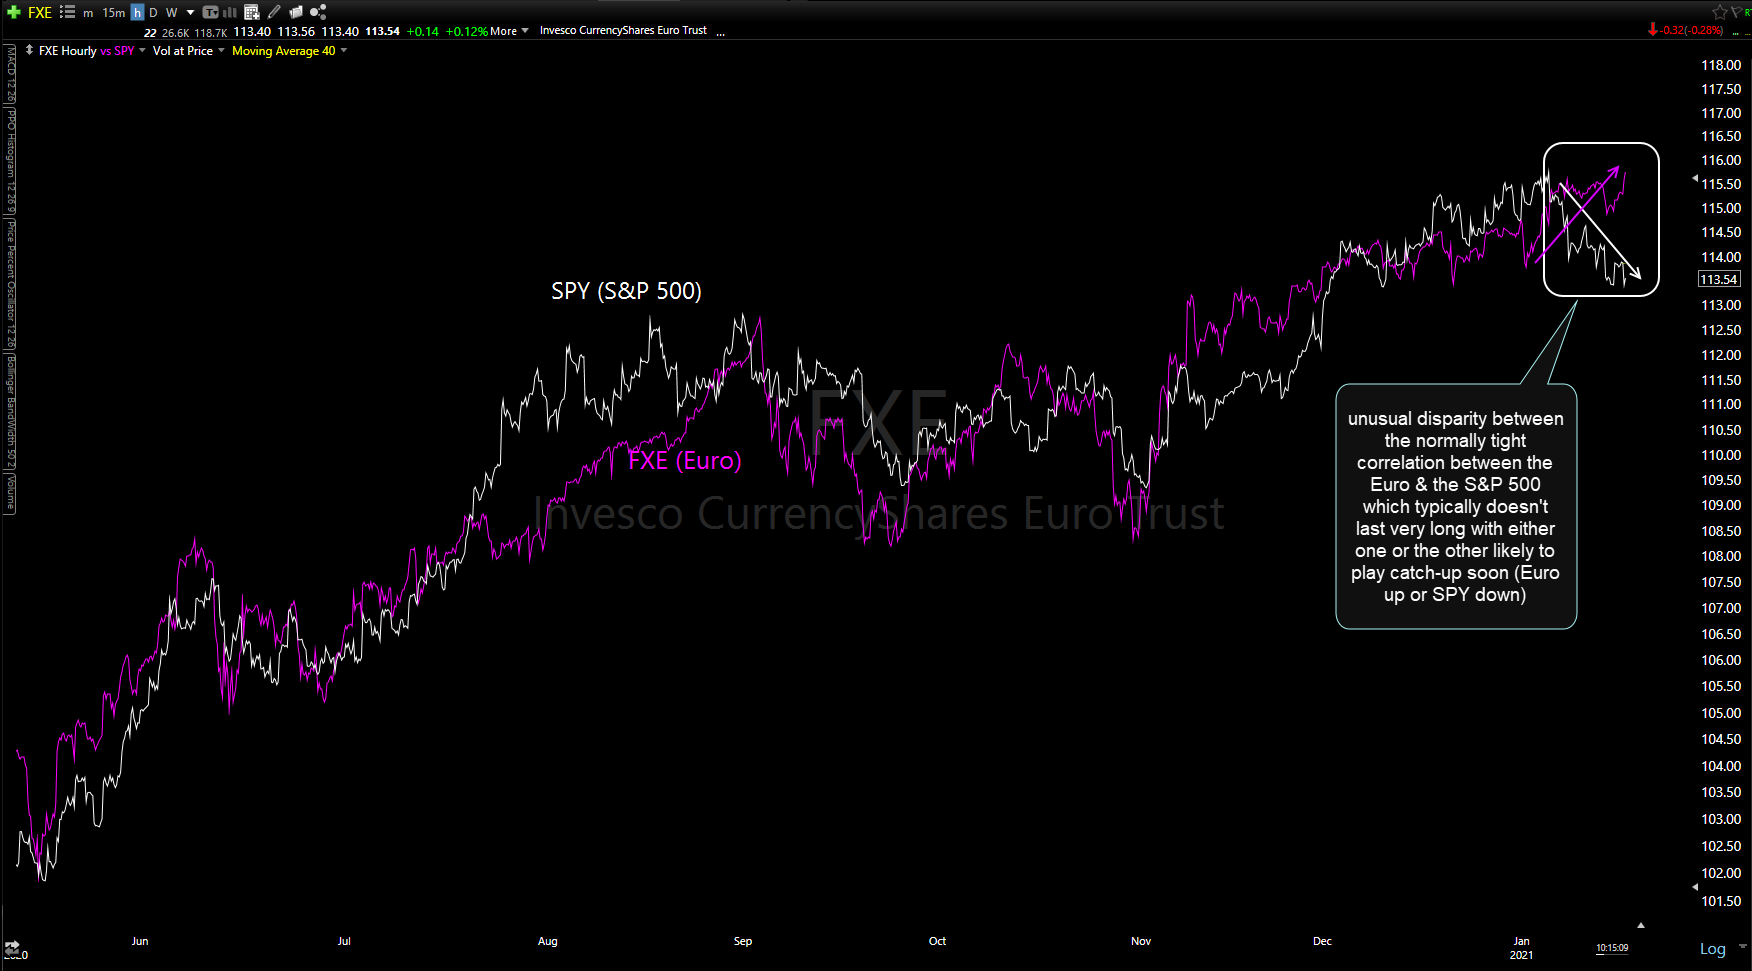
SPY vs FXE 60m Jan 20th
/E7 (Euro futures) reversed off the bottom of the T1 zone (resistance) after a small divergent high but needs to take out yesterday’s lows which should also take it back down below this minor downtrend line that was taken out yesterday. 60-minute chart below.
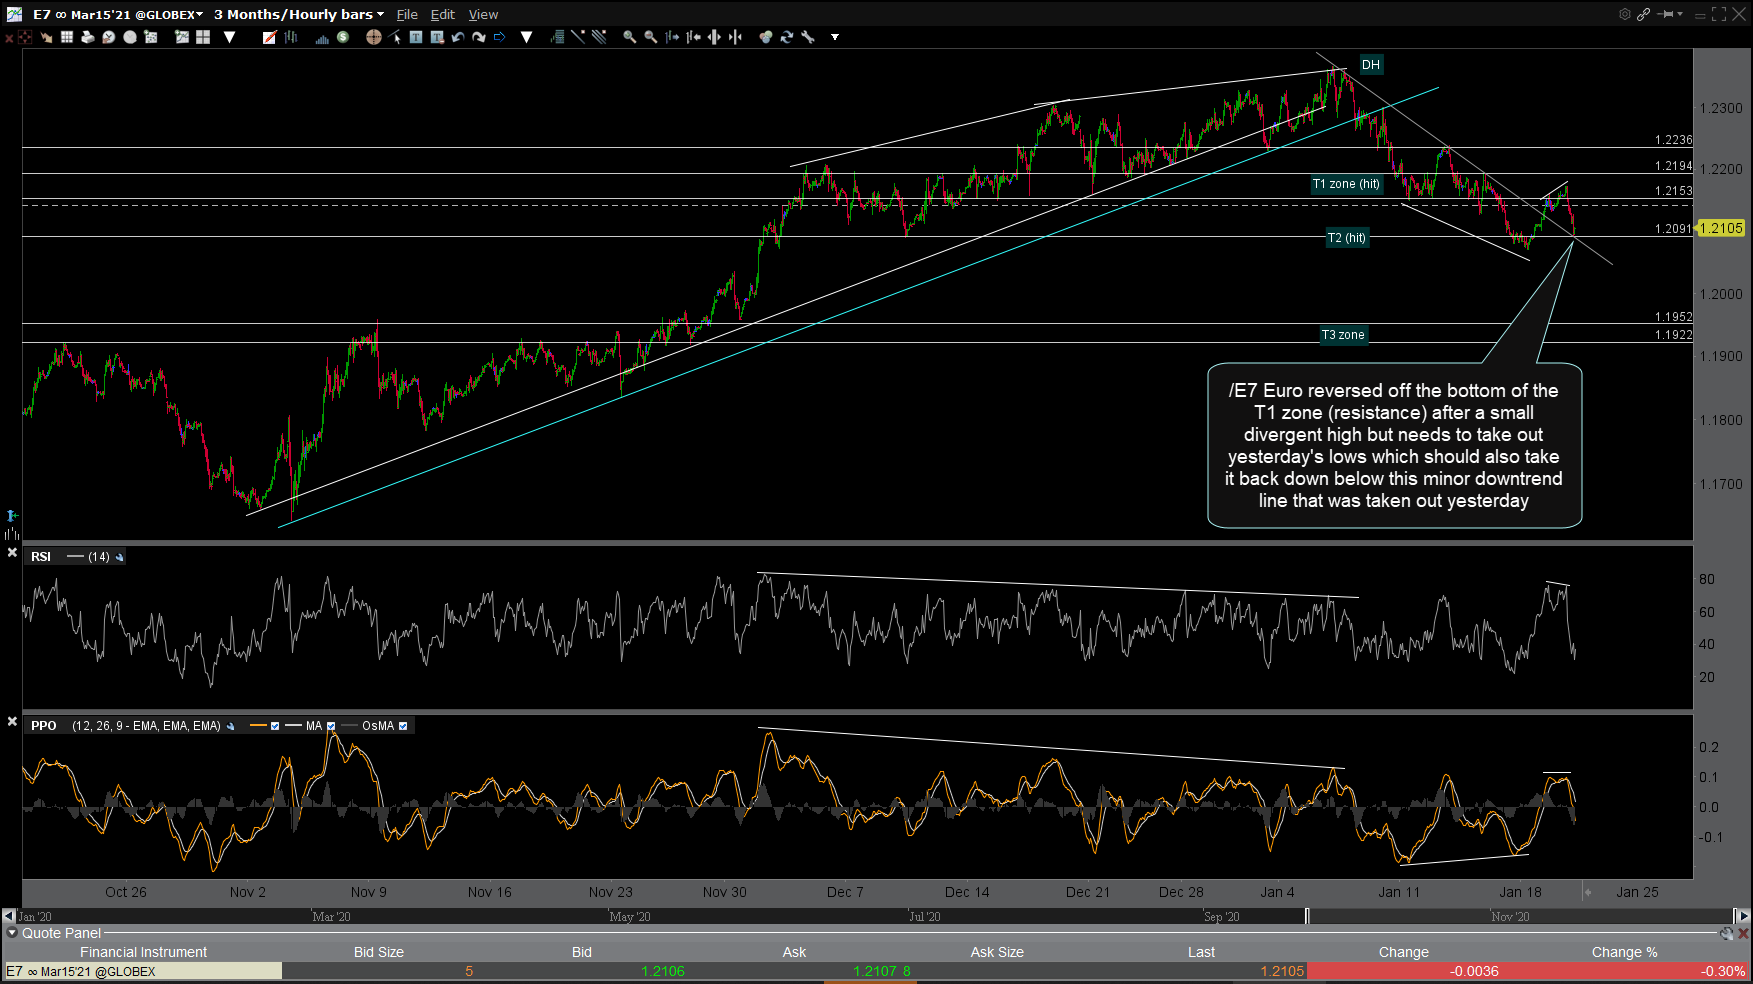
E7 60m Jan 20th
Likewise, /DX ($USD Index futures) remains well within a near-term uptrend following the recent divergent low & breakout with a break above yesterday’s high needed to keep that trend intact. 60-minute chart below.
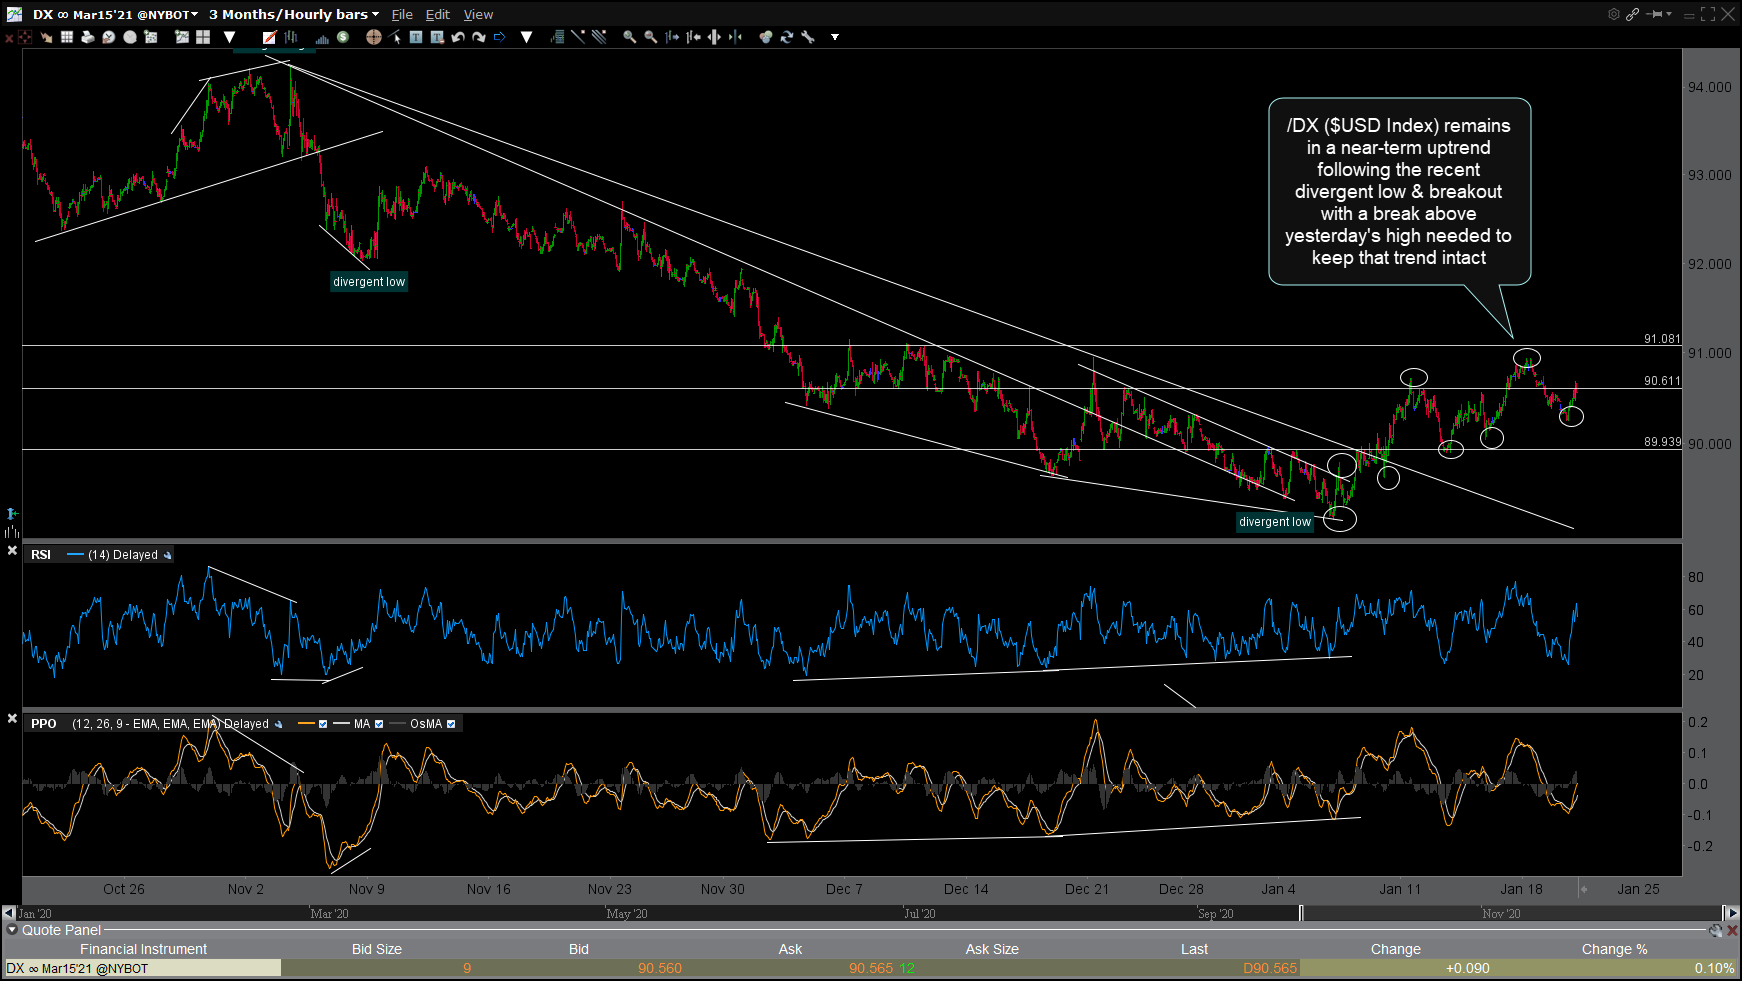
DX 60m Jan 20th
Bottom line: The uptrend in the stock market remains very resilient as it continues to shrug off number developments that have historically lead to a correction such as the recent rally in the US Dollar/correction in the Euro; extreme bullish sentiment readings on the put-to-call ratios & AAII sentiment survey; volume on SPY & QQQ falling to levels which have historically preceded a correction, etc… However, none of those “correction indicators” are exact timing indicators, rather they show conditions that have proceeded corrections in the past anywhere from shortly after they occurred up to several months later. As such, I remain on watch for any sell signals on the daily & weekly time frames of the major indices as well as the next potential buy signal on the $US Dollar & sell signal on the Euro mentioned above.