
Both /ES (S&P 500) and /RTY (Russell 2000) have broken down below their uptrend lines, triggering potential sell signals which would be confirmed on a solid 60-minute candlestick close below the rising wedge pattern and a comparable breakdown on /NQ (Nasdaq 100), which is currently testing trendline support. Updated 60-minute charts below.
-
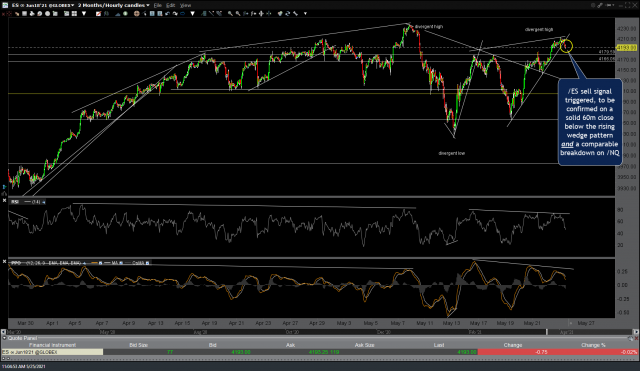
- ES 60m 2 May 25th
-

- RTY 60m 2 May 25th
-
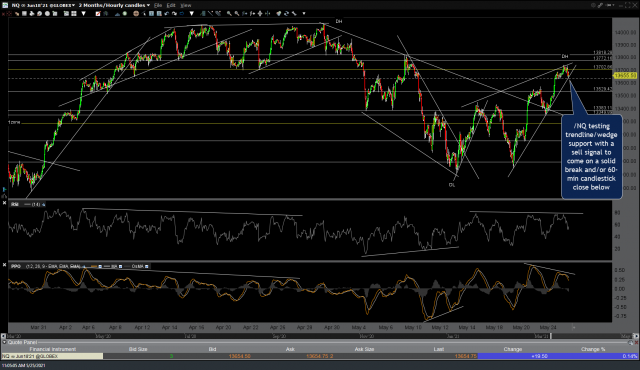
- NQ 60m 2 May 25th
Note: The charts above have been posted in a ‘gallery’ format which will not appear on the new post notifications sent by e-mail but may be viewed by visiting rsotc.com (short url). Click on each chart to expand.