
Lots of potential market-moving releases on this week’s economic calendar so I figured I posts some charts of the major index ETFs & futures with key support levels to watch/trade off this week.
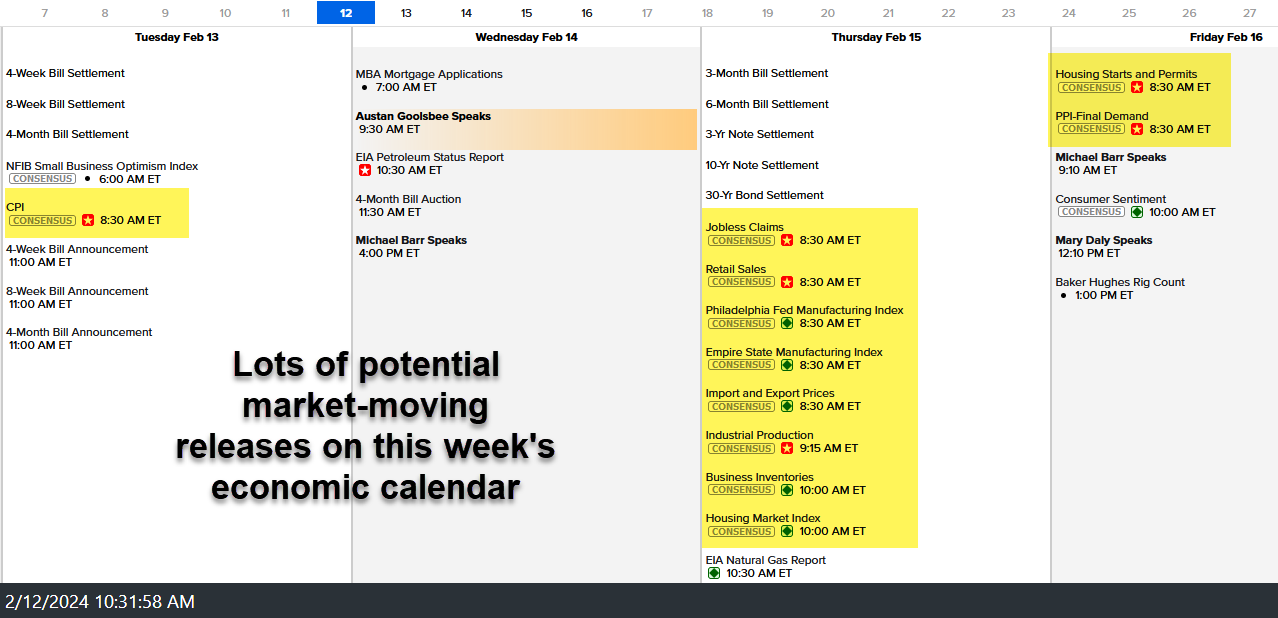
economic calendar Feb 12th
Horizontal lines on all the charts below mark support levels that can be used for those bullish looking to buy the dips or those bearish as potential price targets (or both for flexible long/short active traders). The first sell signal on the market to come on a breaks below these minor trendline on both QQQ & SPY with a more significant sell signal on breaks below their respective primary uptrend lines off the October lows. 60-minute charts below.
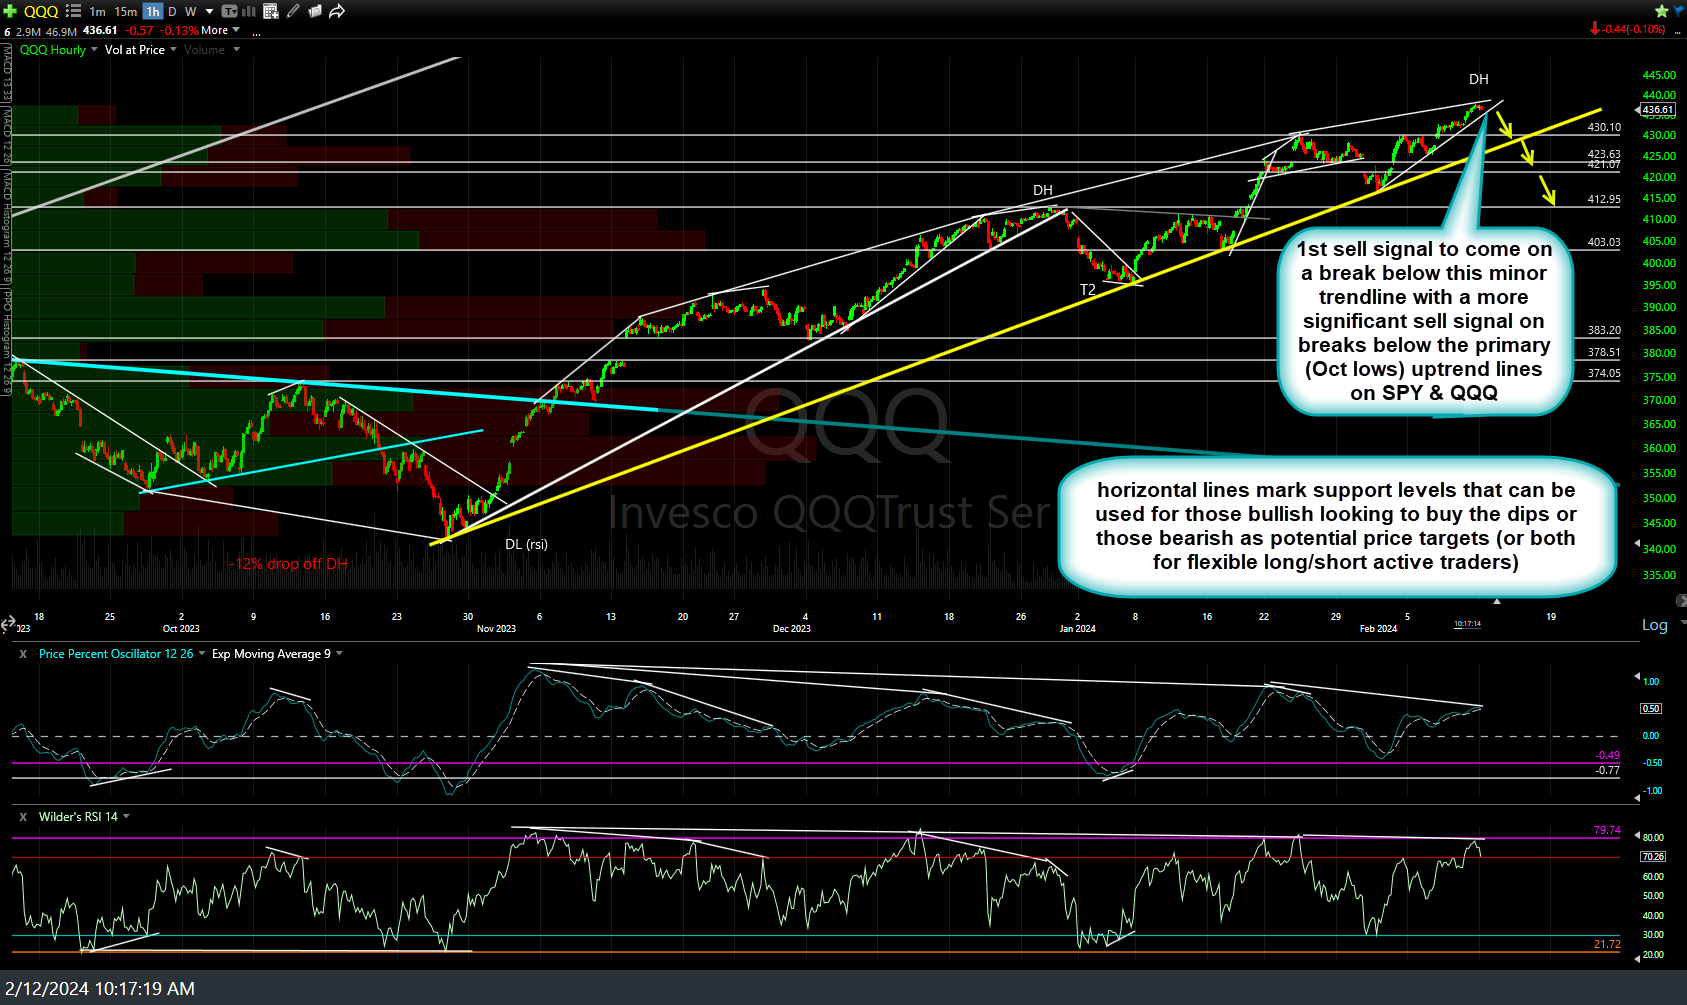
QQQ 60m Feb 12th
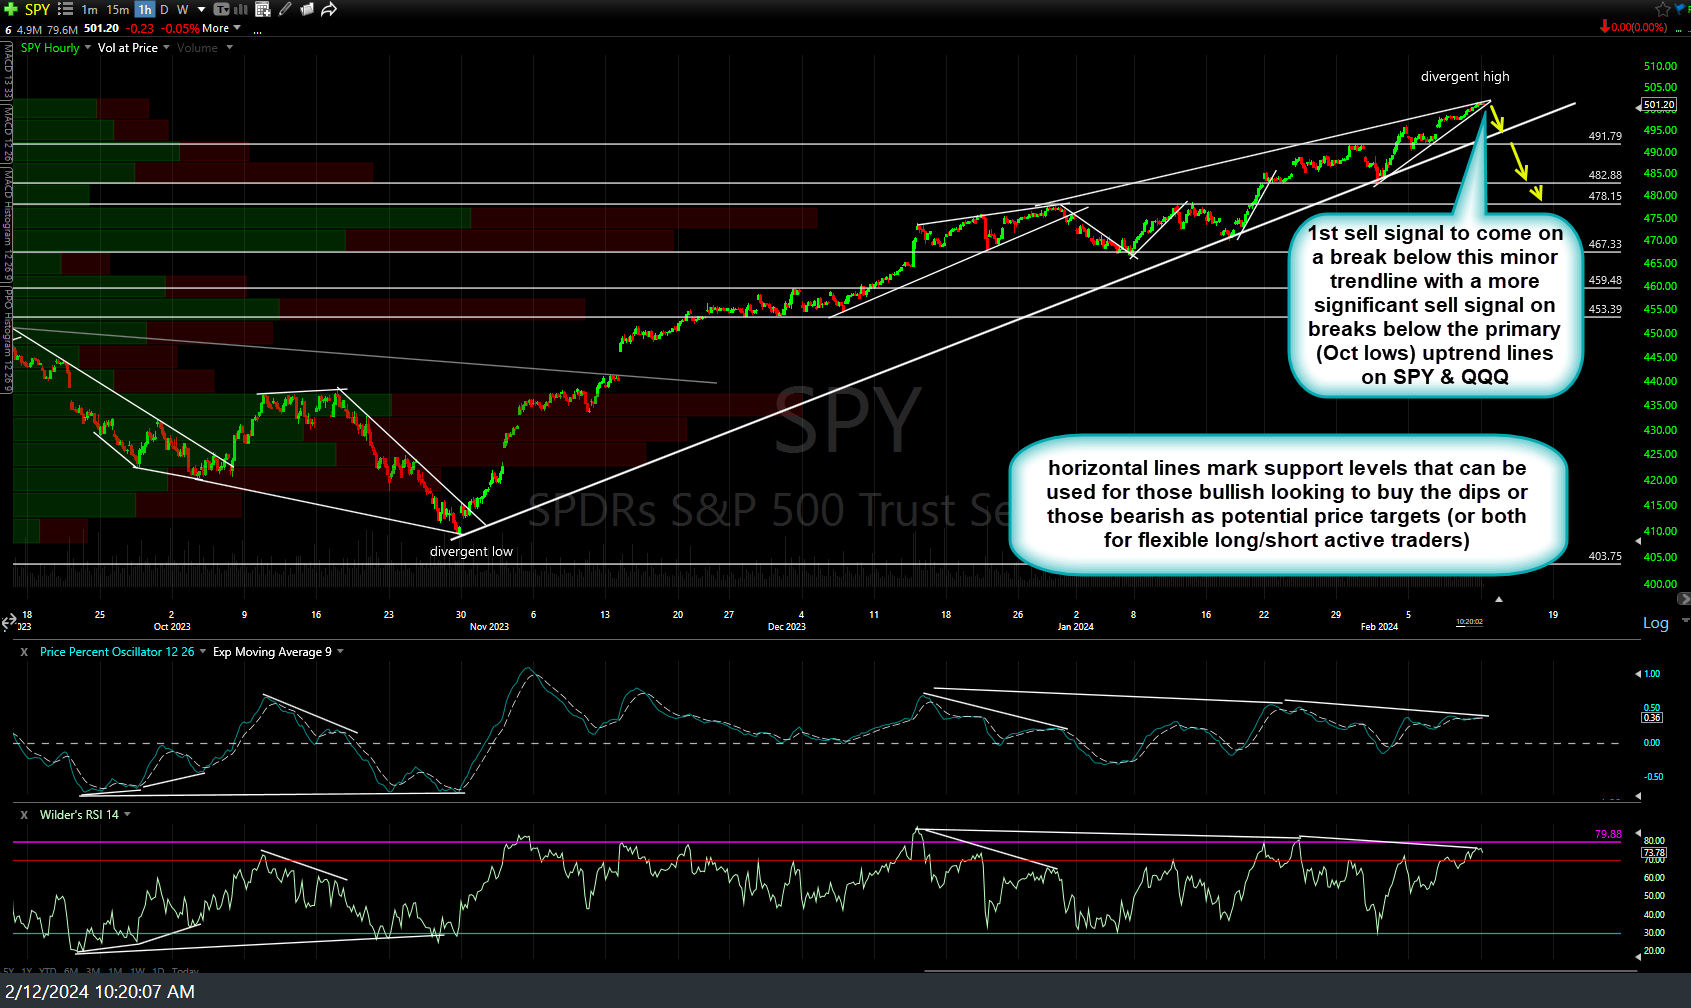
SPY 60m Feb 12th
Likewise, the first sell signal on /NQ & /ES (Nasdaq 100 and S&P 500 futures) will come on a break below the minor uptrend line with a more powerful sell signal on a break below the primary (Oct lows) uptrend line. 120-minute charts below.
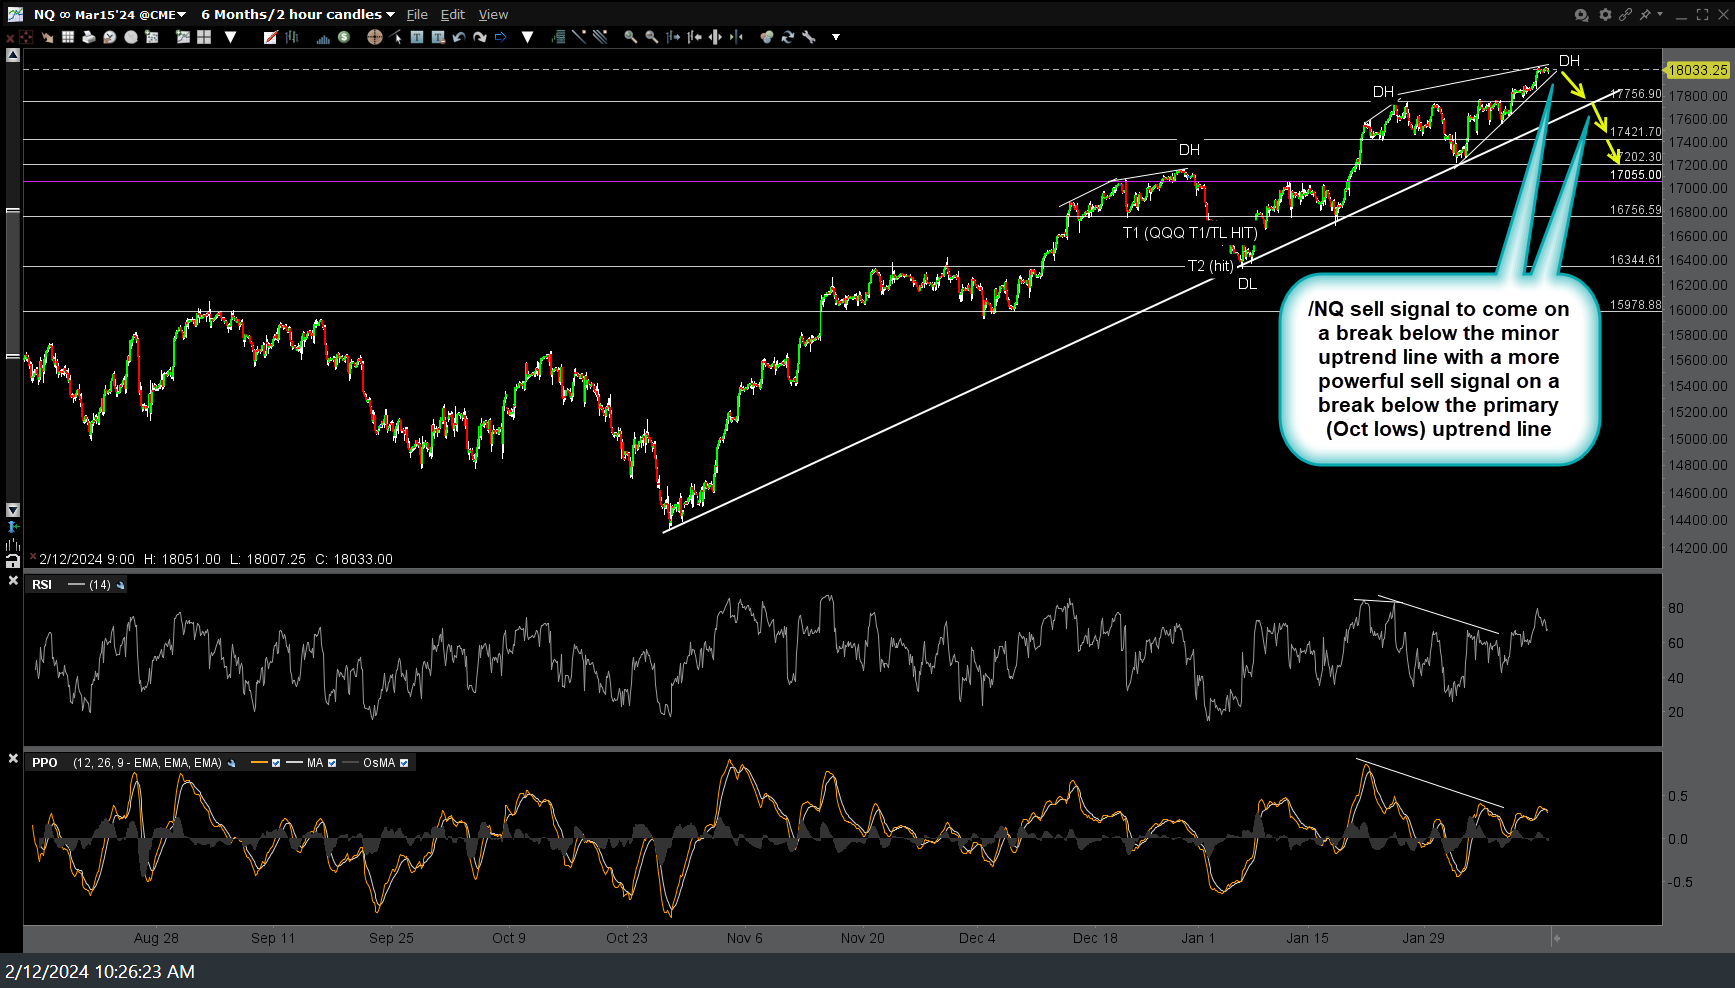
NQ 120m Feb 12th
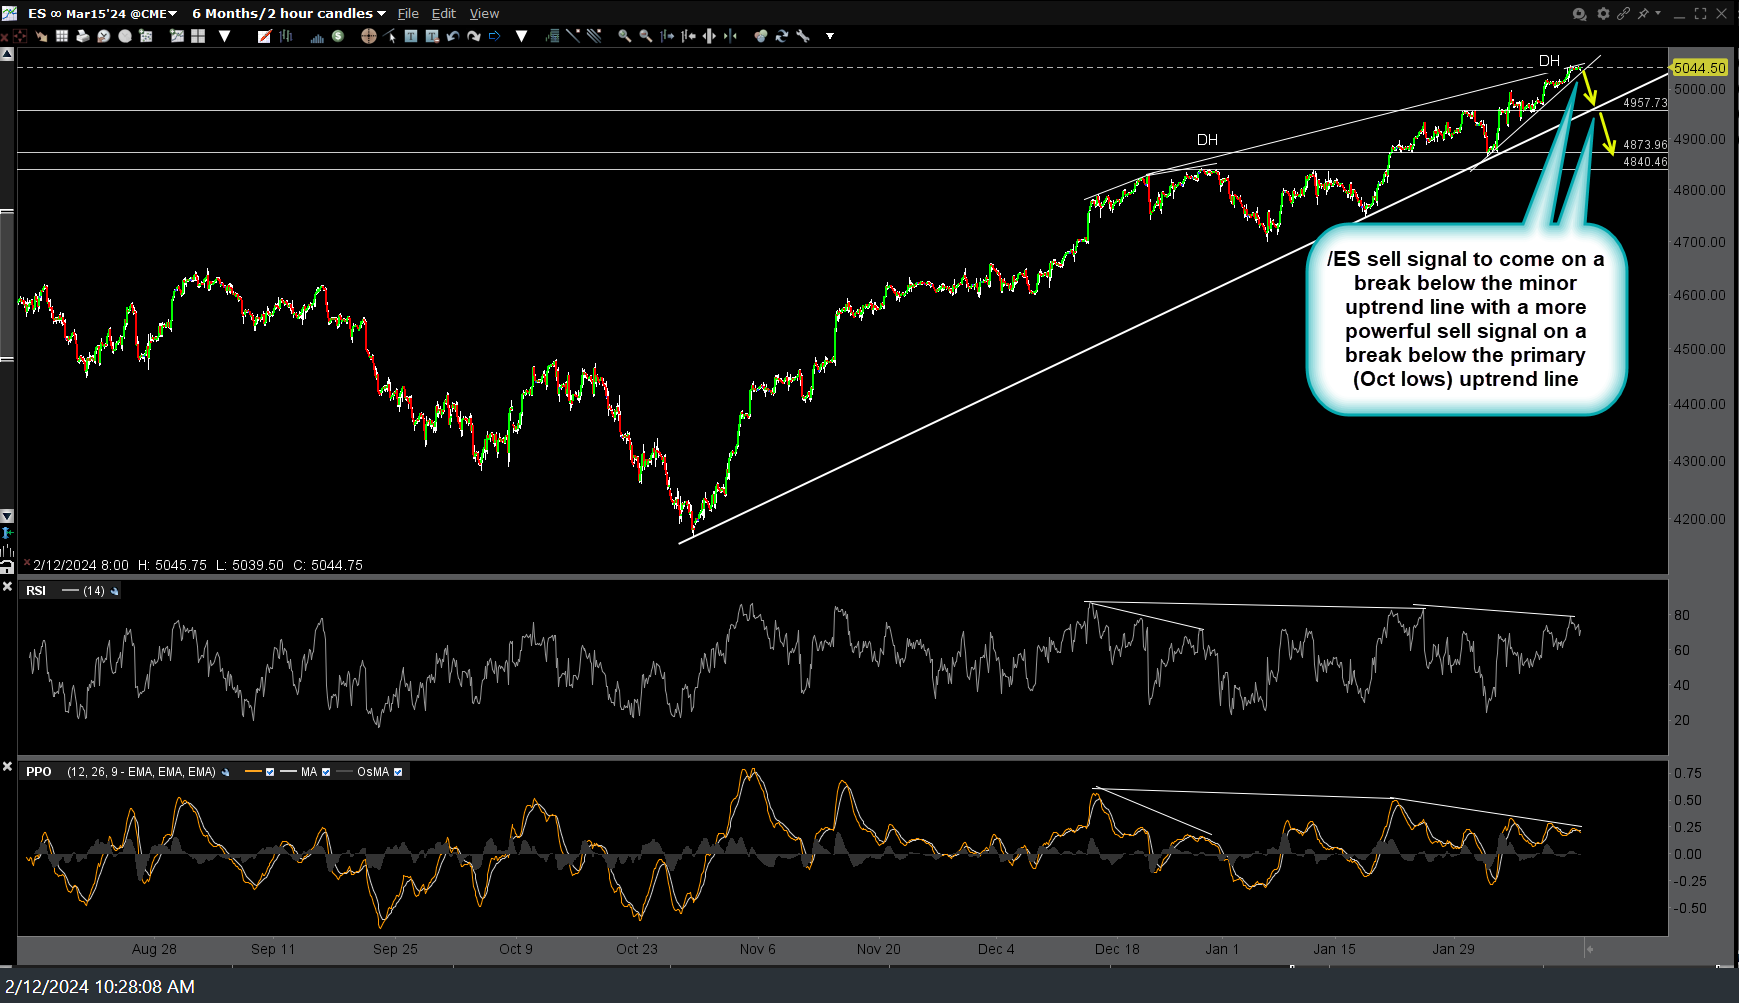
ES 120m Feb 12th
As of now, the markets continue to grind higher at marginal new highs with divergences & overbought conditions on the intraday, daily & weekly time frames without any sell signals at this time. When a security or index is trading at new highs, there aren’t any resistance levels in which to target (if long), enter long on a breakout, or to short into. There are a handful of technical tools, such as Fibonacci projections, that can help gauge potential targets/reversal points but from my experience, those tools have a mediocre track record, at best.
As such, the most (and pretty much only) objective trades for the indexes at this time are:
- Buying pullbacks to support, if bullish & expecting much more upside in the coming day or weeks+
- Shorting breaks below key support levels either as an active trader; covering on the pullbacks to support and/or reversing long for a bounce trade at the support levels that appear likely to produce a tradable bounce – OR – typical swing/trend traders can wait for sell signals to enter (and/or scale into) short positions.