
/NQ (Nasdaq 100 futures) is currently testing the 9997ish resistance with the negative divergences still intact with just over 30-minutes to go before the opening bell. A failure here at resistance with a solid break below this small wedge would likely trigger a drop to any or all of the support levels shown below while a solid upside break would trigger a run at the previous highs although the divergences will remain intact on any marginal new high. 60-minute chart below.
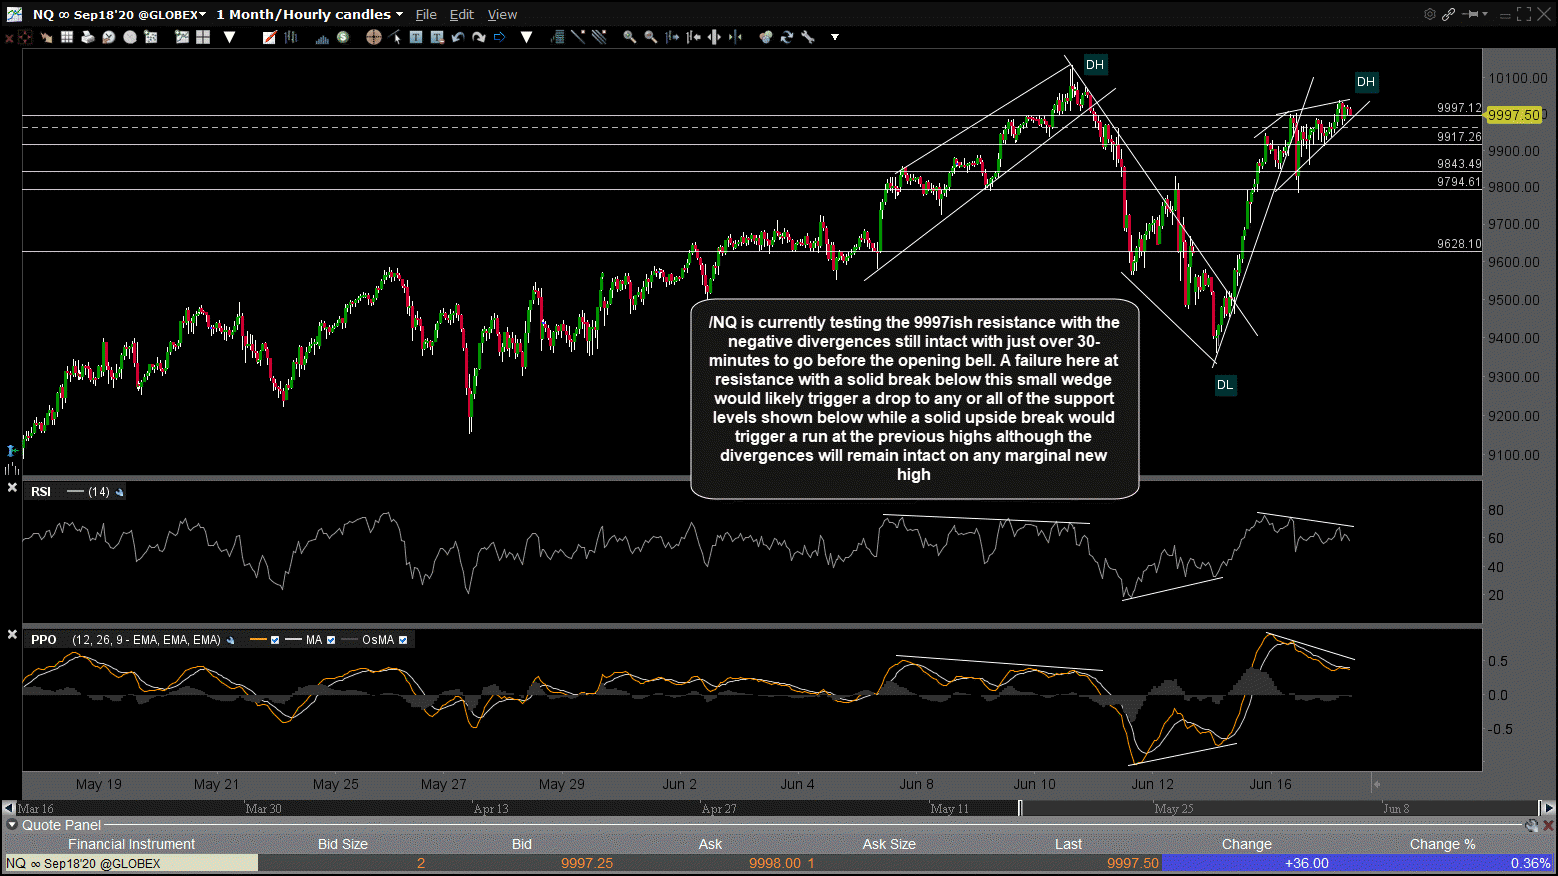
NQ 60m June 17th
/ES (S&P 500) has a comparable minor uptrend line as /NQ, in which a near-term sell signal would be triggered if both are taken out. Should /ES rally another 1.6% or so up to the 3175 resistance level & do so soon, the negative divergences that were in place at the previous high will be extended. That 3175 resistance also coincides with the bottom of the recent Island Cluster Top on the SPY daily chart & remains a significant resistance level: Bullish if SPY breaks & closes solidly above the cluster, bearish if it fails to do so.
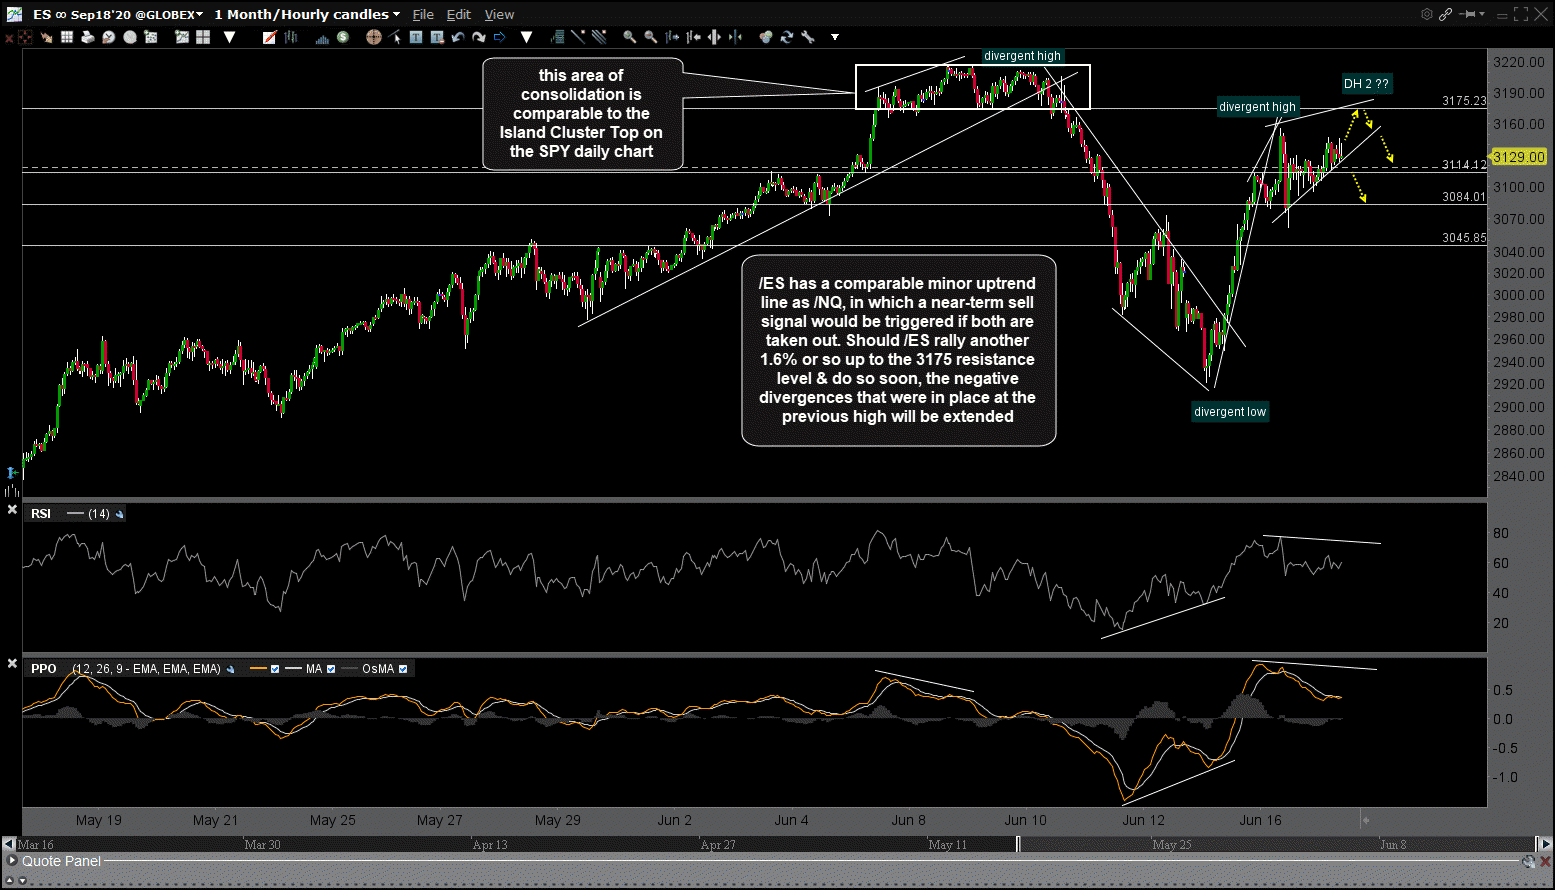
ES 60m June 17th