
/ES (S&P 500 futures or SPY) offers an objective long entry here at the 5792 support with positive divergence with stops somewhat below, ideally in the regular session. 60-minute chart below.
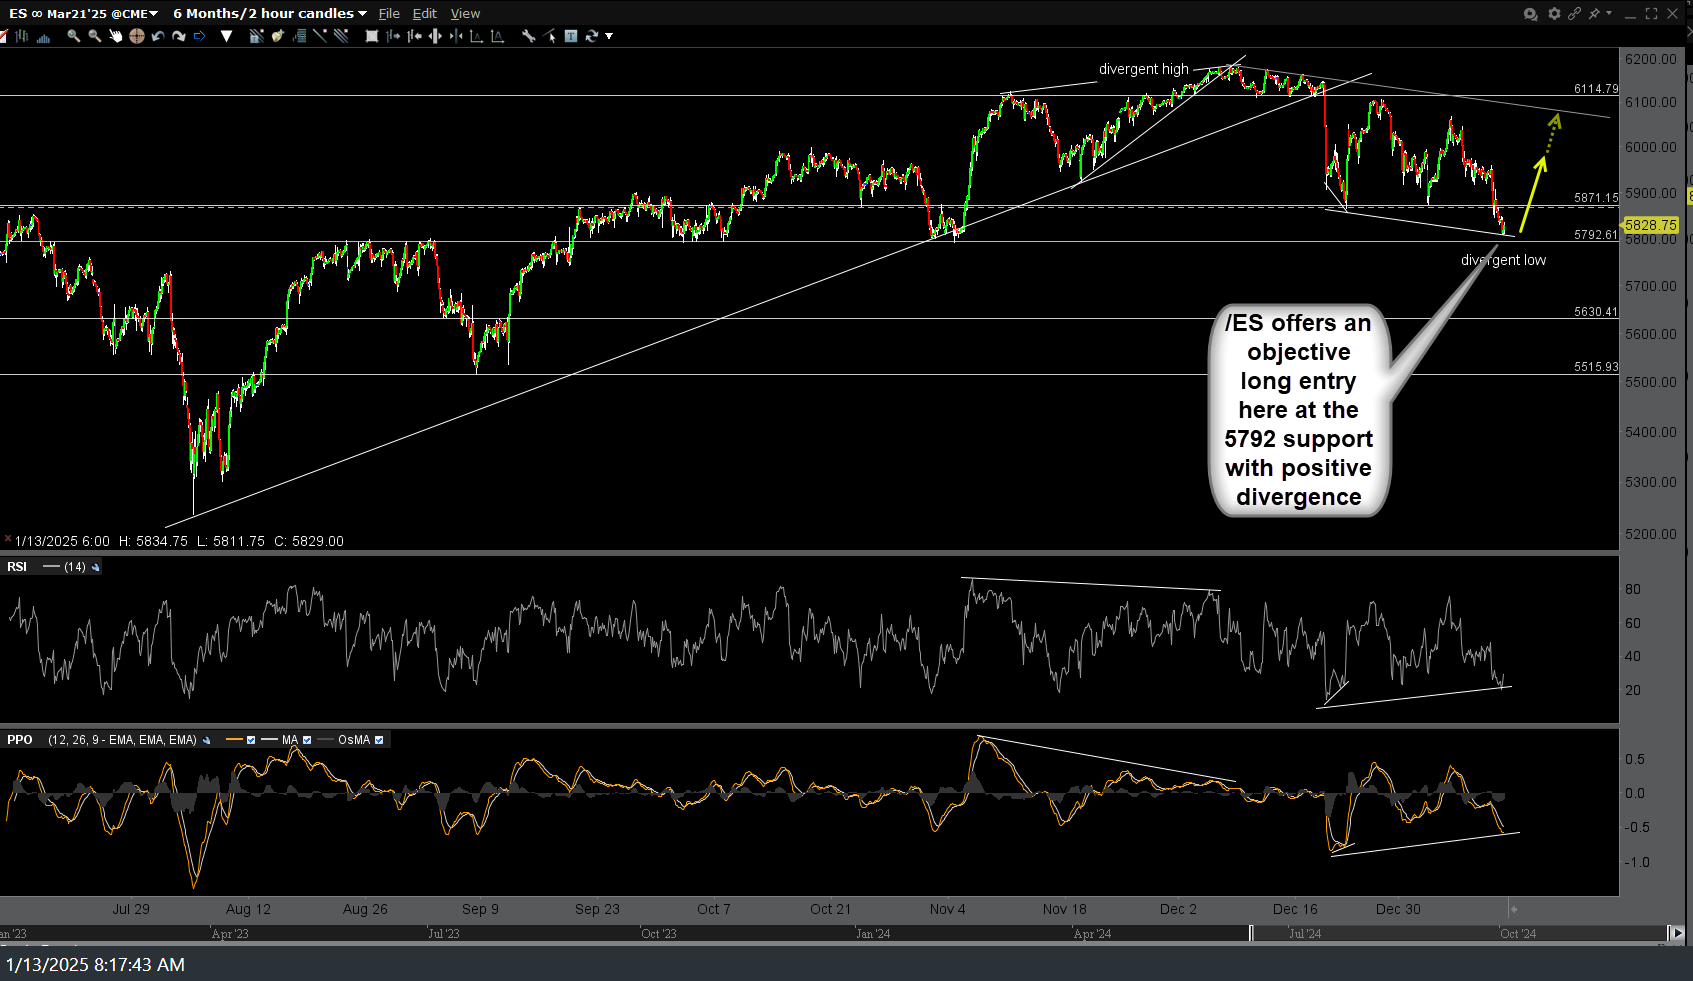
ES 60m Jan 13th
This pre-market session dip below the 20993 support on /NQ (Nasdaq 100 futures) looks like a textbook stop raid with a buy signal on /NQ or QQQ to come on a recovery back above 20993. 60-minute chart below.
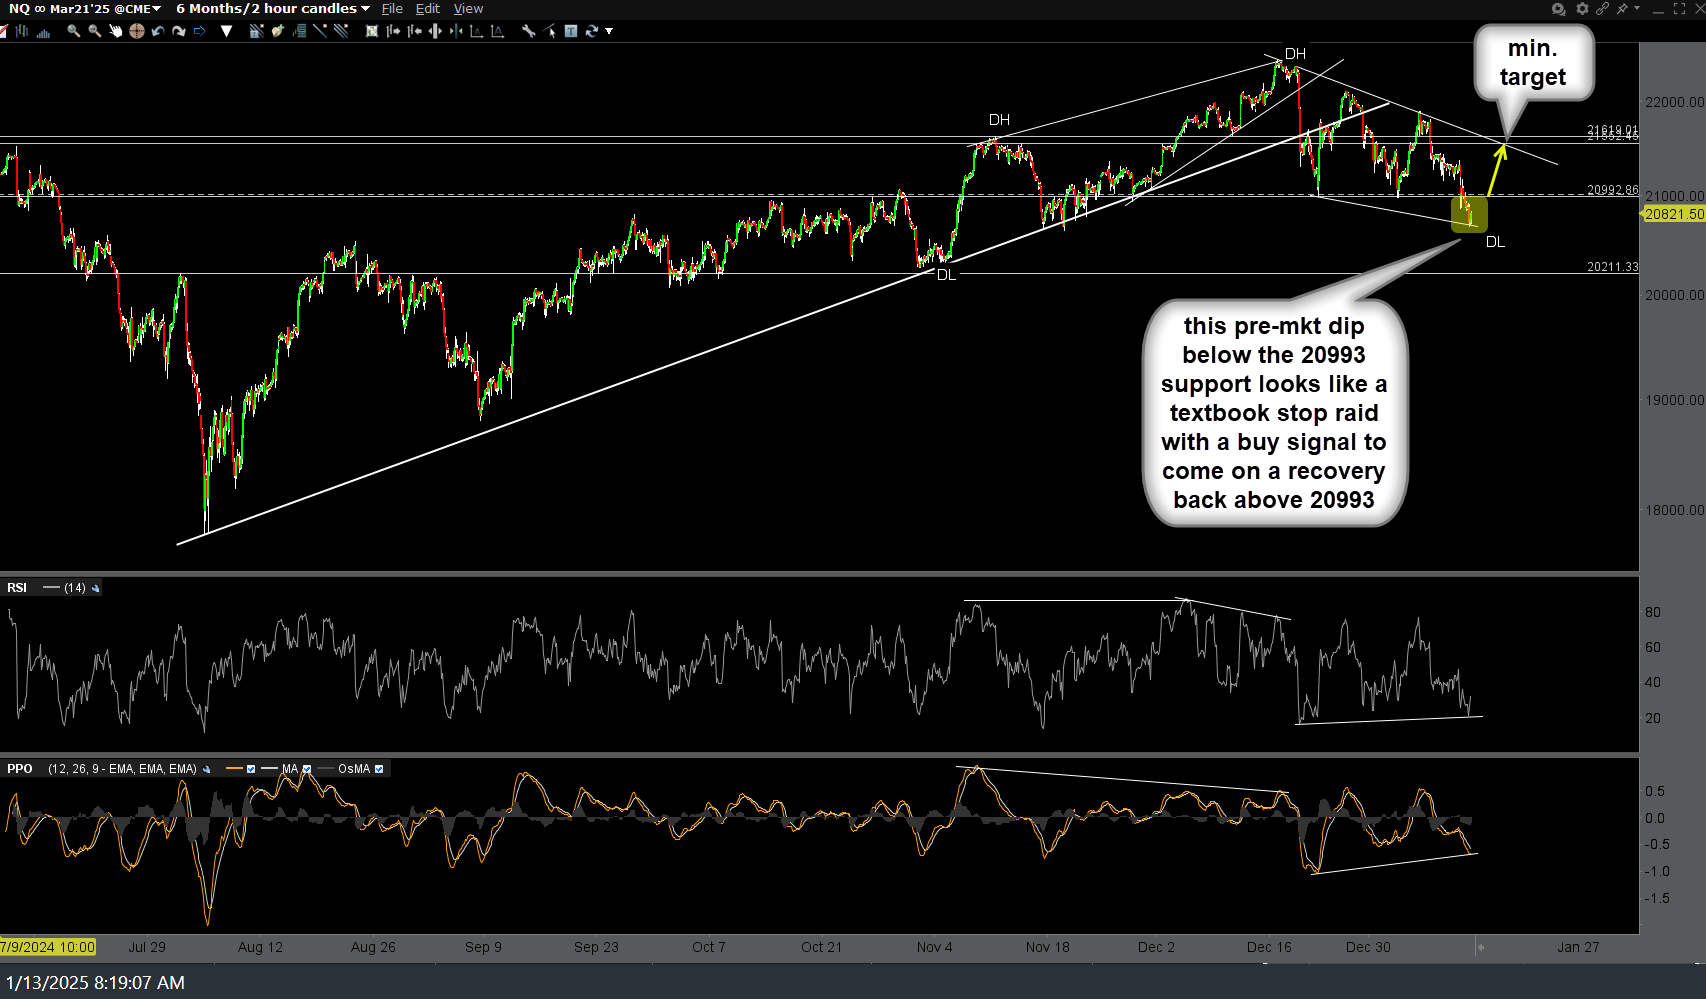
NQ 60m Jan 13th
Likewise, /ZN (10-yr T-bond futures) still appears primed for a short-covering rally on a breakout above the 60m bullish falling wedge pattern. Any strong rally in Treasuries will also likely coincide with a short-covering rally in equities. 60-minute chart below.
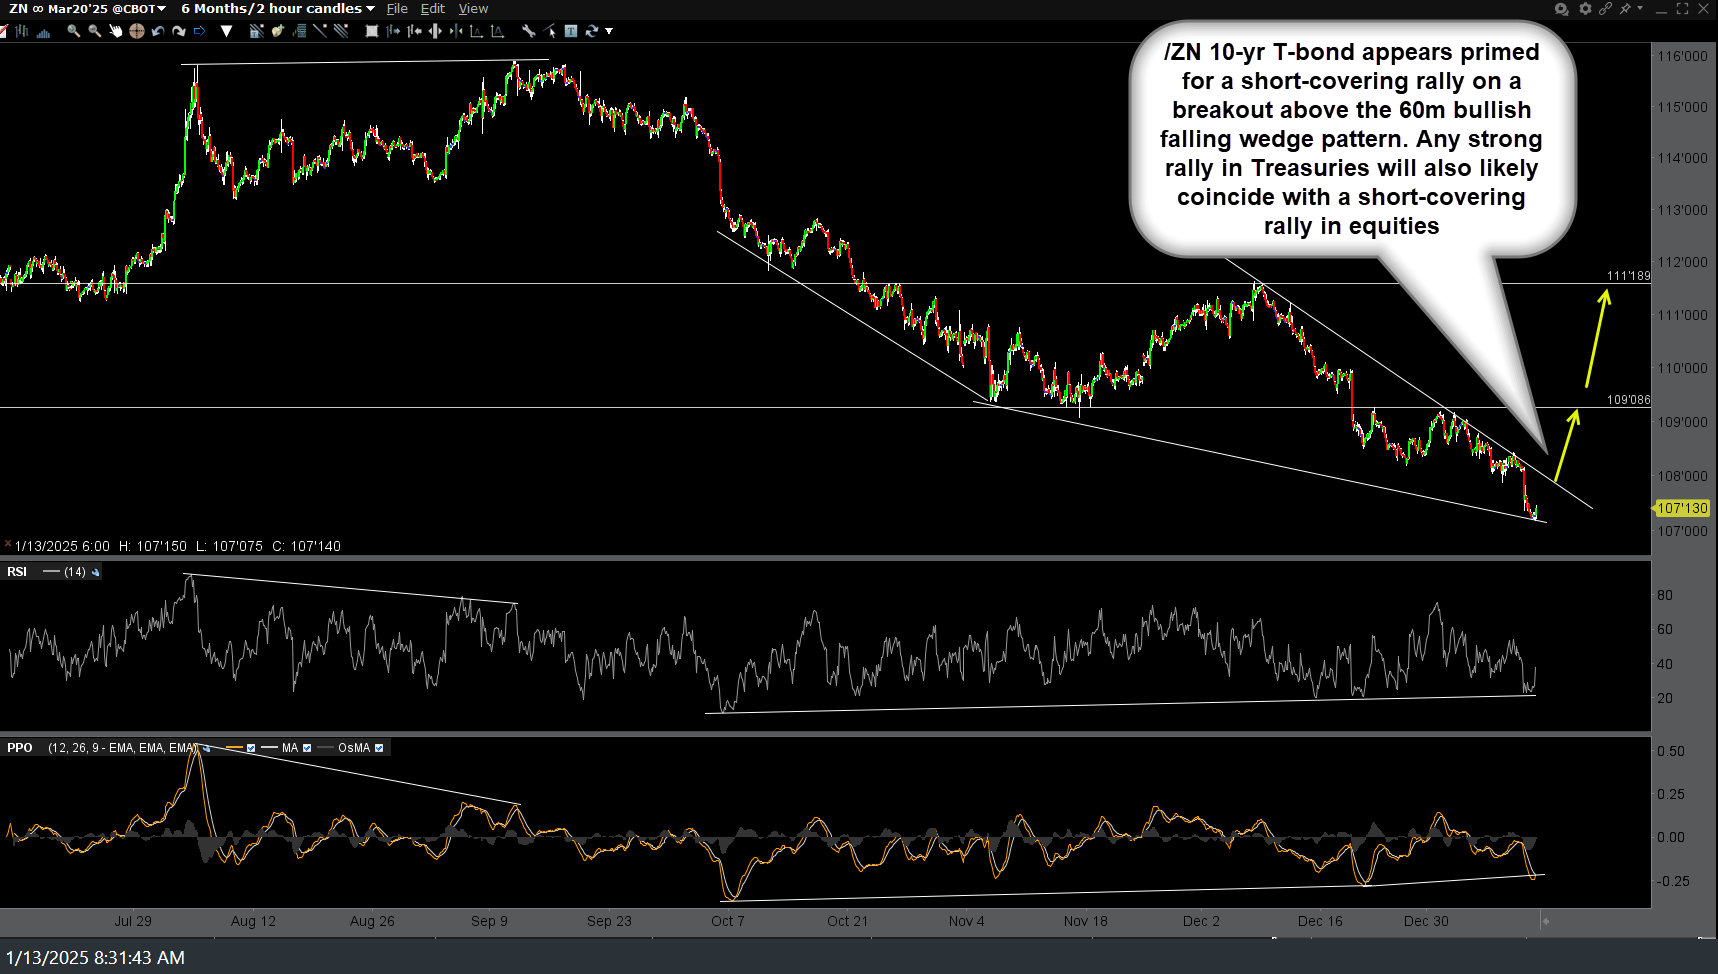
ZN 60m Dec 13th
/ZB (30-yr T-bond) also still looks primed for a strong short-covering rally, likely to be sparked on a breakout above this 60-minute bullish falling wedge pattern.
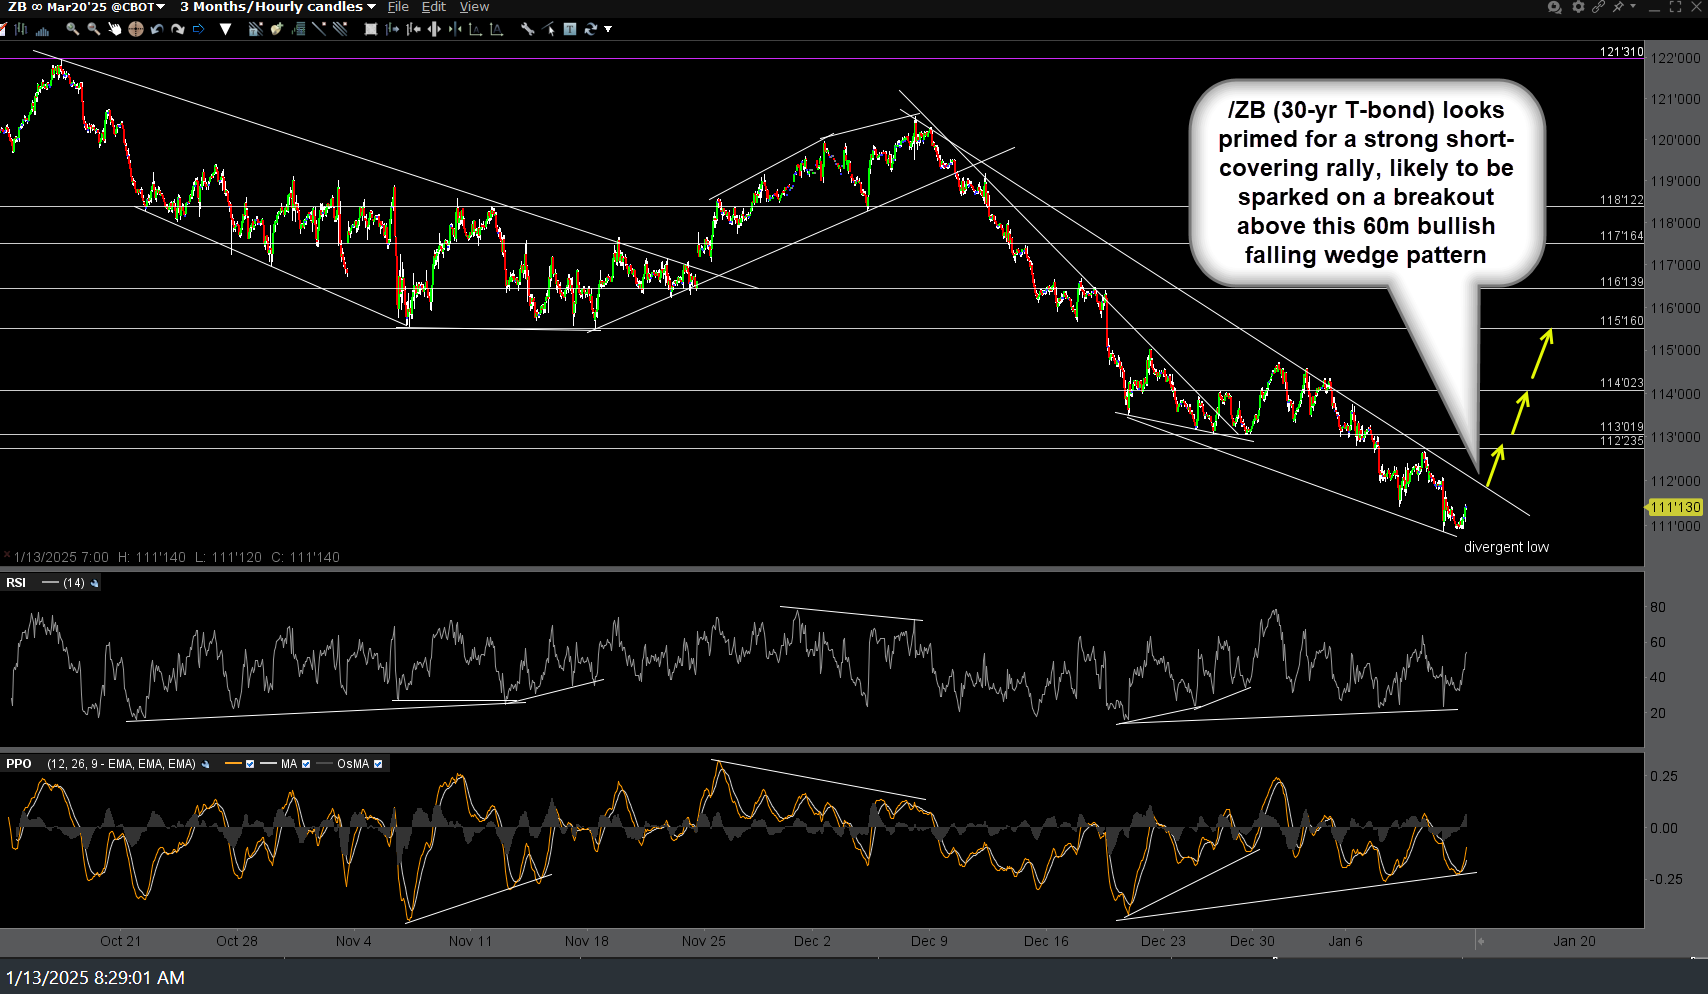
ZB 60m Jan 13th
Longer-term sell signals on the stock market remain intact for now while the odds for a potentially sharp oversold/short-covering rally continue to increase, especially in the aforementioned triggers occur today or early this week.