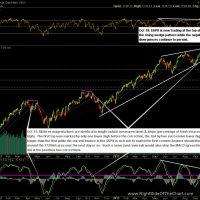
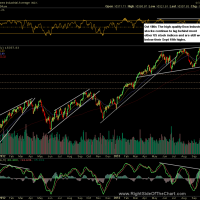
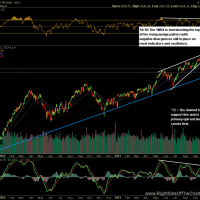
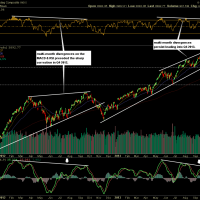
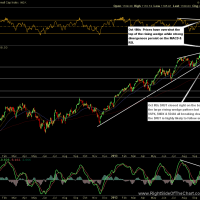
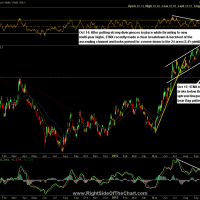
The first series of charts below are some of the major US stock indices, including annotations. Basically, most US indices, other than the Dow Jones Industrials, continue to make higher highs while nearly all key momentum indicators and price oscillators continue to print lower highs (i.e.- negative divergences). Such multi-month divergences were also formed leading up to correction in the 4th quarter of 2012. Divergences of such magnitude don’t always play out for a significant correction but more often than not, they do. This has been one of the most resilient markets in years, continuing to power higher despite many fundamental and technical caution signs yet the trends on all time-frames (including the short-term trend) are currently bullish. As such, the risk/reward for establish both long or short positions is not very favorable at this point. I will continue to post the most attractive trade setups, long and short, with my own preference remaining to be very selective on establishing any new positions as well as keeping my position sizing small until a more favorable risk/reward profile on either the long or short side develops.
- S&P 500 Daily Chart
- Dow Industrials Daily Chart
- Nasdaq 100 Daily Chart
- Nasdaq Comp Daily Chart
- Russell 2000 Daily Chart
Moving on to the fixed-income markets, in particular the US Treasuries, yesterday both the $TNX (10-year Treasury Yield Index) and $TYX (30-year Treasury Index) both experienced impulsive breakdowns which increases the odds of my previous discussed scenarios (rates down) playing out. Assuming that my price/yield targets are hit, beyond the trading opportunities, one might find these charts useful in other applications. For example, a lot of potential home buyers were caught off guard by the recent surge in interest rates from early May through early September. Those looking to refinance an existing mortgage or maybe looking purchase a rental property might have held off due to the sharp rise in borrowing costs. If (and that’s a big IF), treasury yields reach my price target of 2.4% on the 10-year note, that would about a 13% decrease from the 2.75% peak yield on the 10-year note just 3 days ago. As with most of the stock index charts above, links to the live, annotated charts of $TNX & $TYX are available from the new Live Chart Links page.
- 10-year Treasury Yield Index
- 30-year Treasury Yield Index
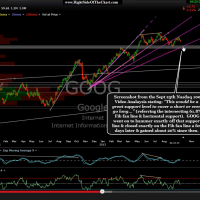
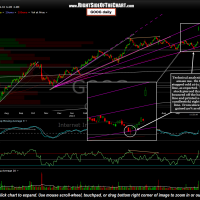
In these final charts, I just wanted to highlight an nice example of technical analysis working. For the last several months, I discussed in detail (in several of the market videos posted on the site) how well the Fibonacci fan lines on the daily chart of GOOG have acted as support and resistance. In the recent Nasdaq 100 Video Analysis posted on Sept 25th, while GOOG had just recently rolled off the backside resistance of the 50% Fib fan line and was moving lower, I stated that the 61.8% fan line along with horizontal support line that I drew in that video would be “…a great support level to cover a short or even go long…”. Let me be very clear that I did not personally buy GOOG there, nor did I add it as an official trade idea. I just wanted to impress the fact that I often cover many trade ideas in the video updates on the site (which are not always added to the trade ideas category) but more so I just wanted to highlight this as an example of the beauty of technical analysis.
- Screenshot of GOOG from 9/25 Video
- GOOG Updated Daily Chart
The first chart above is the screenshot from that video with the second chart showing not only today’s big earnings-induced pop in the stock, but a zoom-in of how well the stock acted off those aforementioned dual support levels. After the video, GOOG continued moving lower finally stopping cold exactly on on the first tag of the 61.8% Fib fan line on Oct 8th. The next day, GOOG made a very brief intraday pierce of that Fib support line to make a perfect kiss of the horizontal support line just mere basis points below. From there, the stock quickly reversed, closing the day right back on top of the Fib fan line and never looked back. Again, hindsight only in the fact that I did not personally take GOOG but a good educational example of how multiple support levels, particularly intersecting trendlines, horizontal support levels, Fibonacci retracements or fan lines, etc… can be use in conjunction as dual (or triple) support levels help increase the odds of a bounce once those levels are hit. As a side note, from here I don’t have much of a read on the stock. As GOOG is now trading at a new all-time high, there is not any overhead resistance other than another possible high-level backtest of the 38.2% fan line. I definitely wouldn’t chase GOOG here nor would I bother shorting it unless/until we get some type of high-probability reversal pattern over the next week or so.


