
Here’s a look at the 60-minute charts of the equal weighted indexes for the Nasdaq 100 and S&P 500 that were discussed in the video published earlier today, followed by the regular $NDX & $SPX 60-minute charts. The equal weighted index charts paint a different picture than the normal indexes, which apply a heavier weighting to the handful of FAAMG stocks that are nearly single-handedly driving today’s rally in the large cap indices.
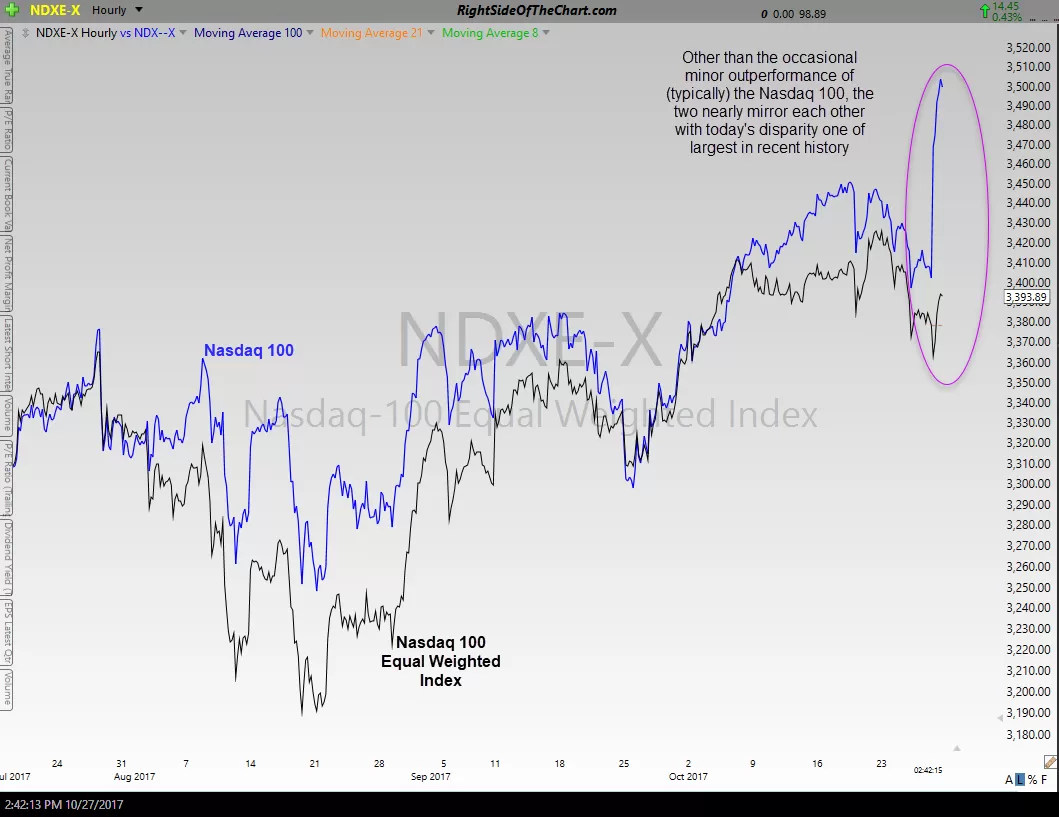
The 60-minute chart that follows shows the very unusual recent disparity in performance between the $NDX & $NDX-E (equal weighted) indexes. Key technical levels as well as the divergences that still persist in the cap-weighted indexes as they push to new highs today are shown.
-
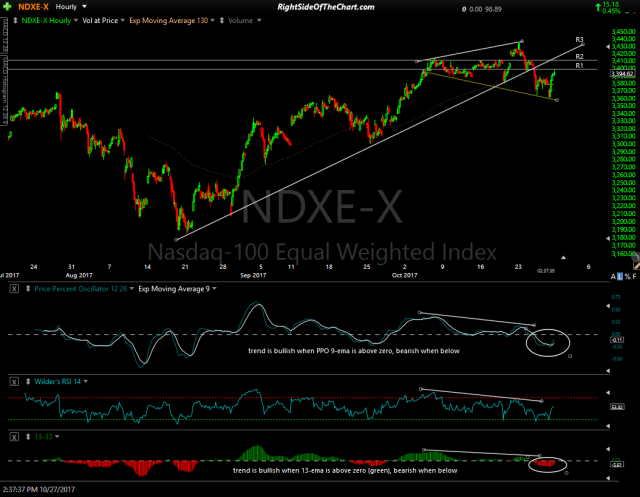
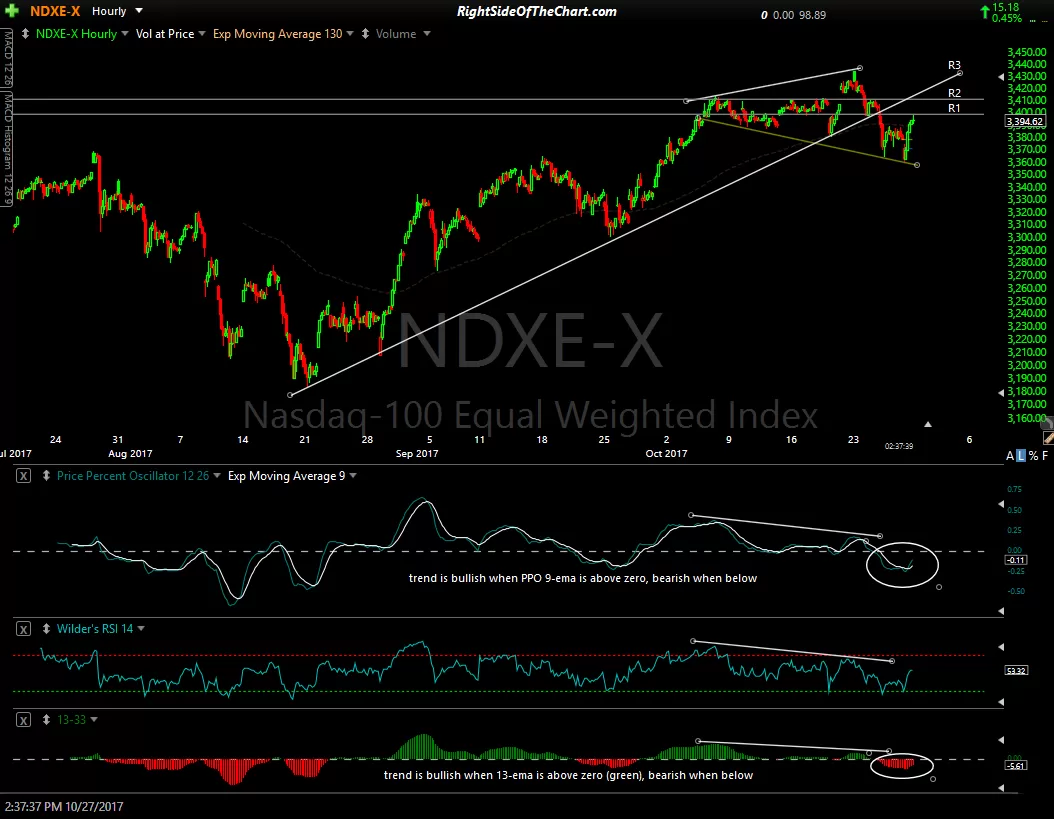
- $NDX-E 60-min Oct 27th
-
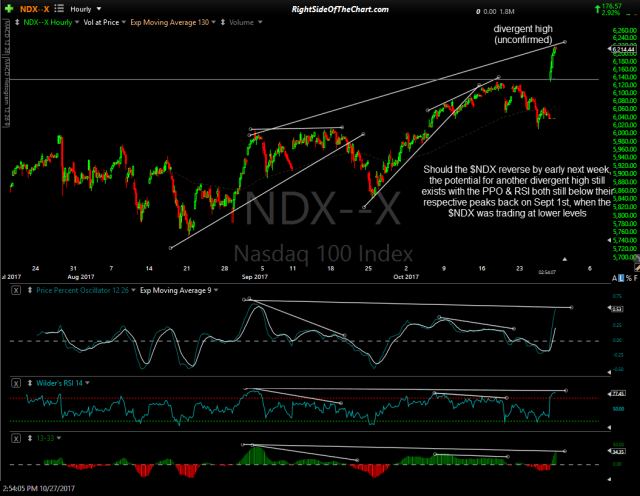
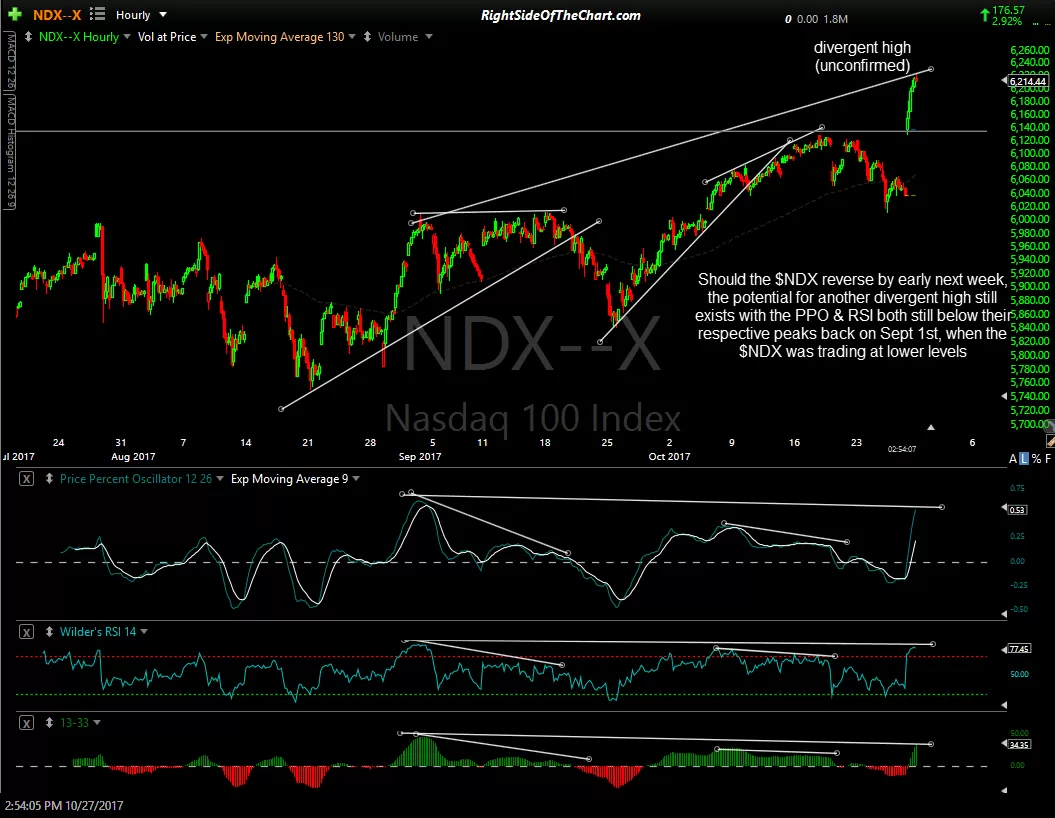
- $NDX 60-min Oct 27th
-
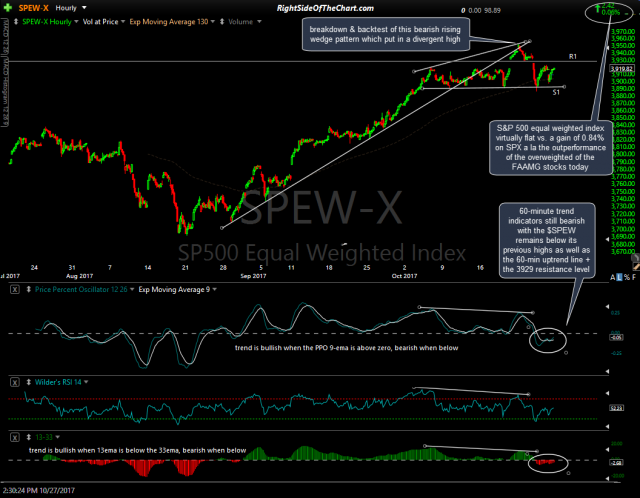
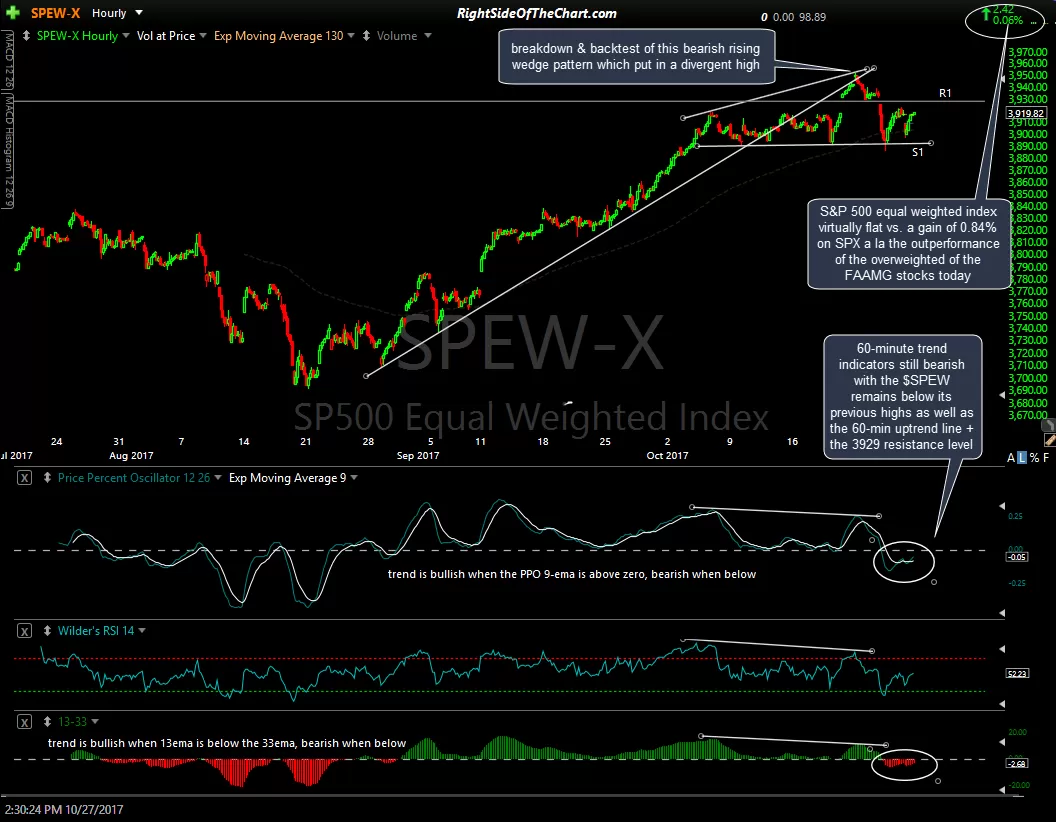
- $SPEW 60-min Oct 27th
-
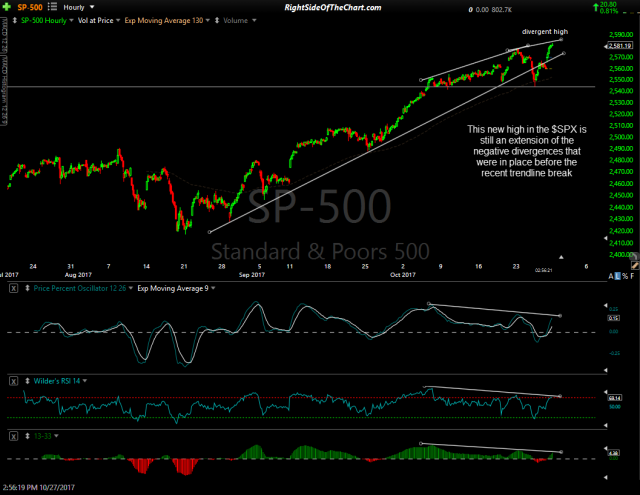
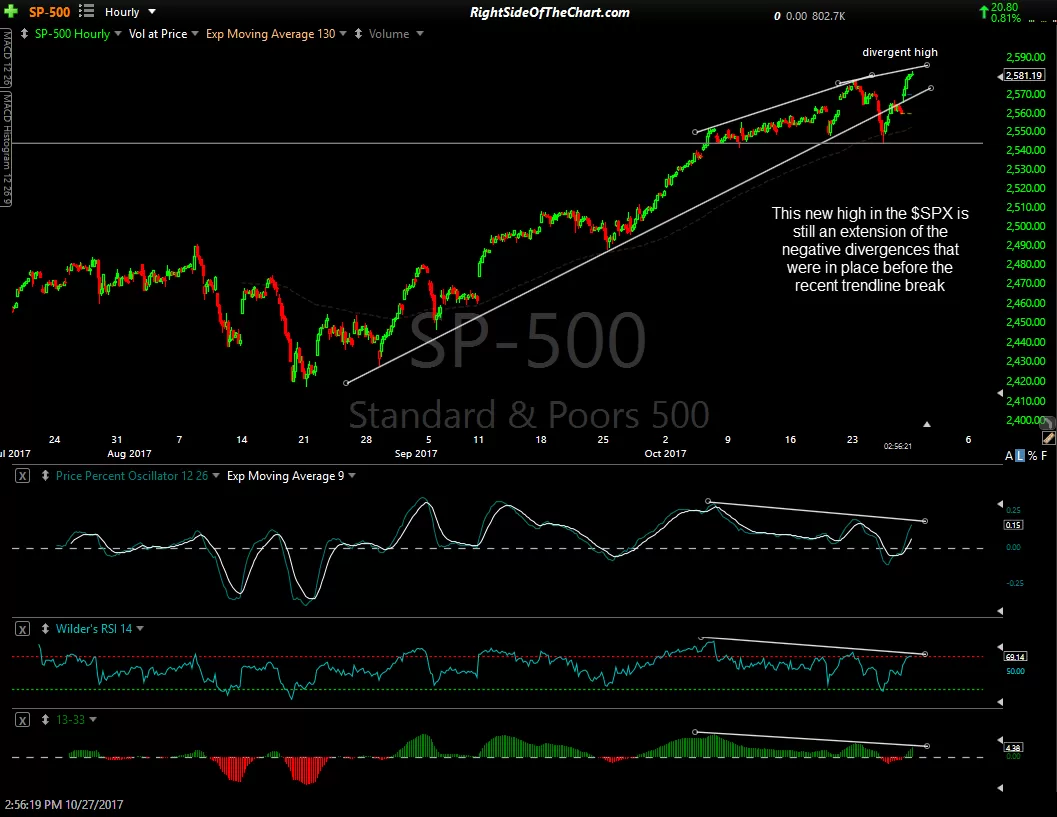
- $SPX 60-min Oct 27th
-
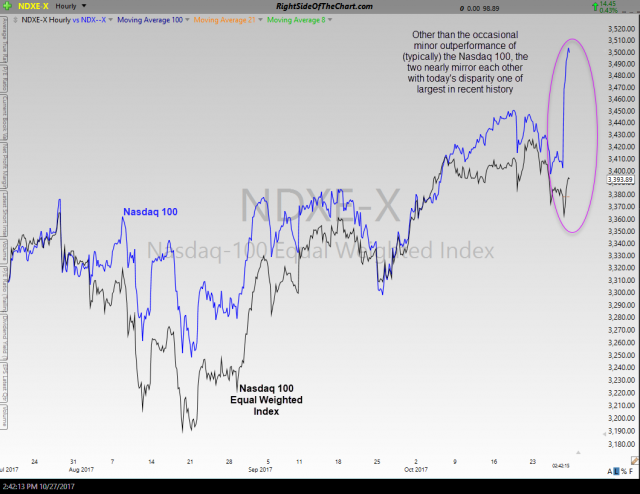
- $NDX vs. $NDX-E 60-min Oct 27th
Click on first chart to expand, then click anywhere on the right of each expanded chart to advance to the next chart. Once expanded, charts can be panned & zoomed for additional detail.