The following video provides early-session technical analysis of the US stock market (QQQ, /NQ & SPY), gold, silver & natural gas, highlights below:
-
- The stock market remains more conducive to active trading vs. typical swing or trend trading due to the increasingly bearish technical postures as well as the proximity to key support levels on the daily & weekly time frames coupled with the fact that the market has traded in a large, mostly sideways trading range for the past 6-months or so.
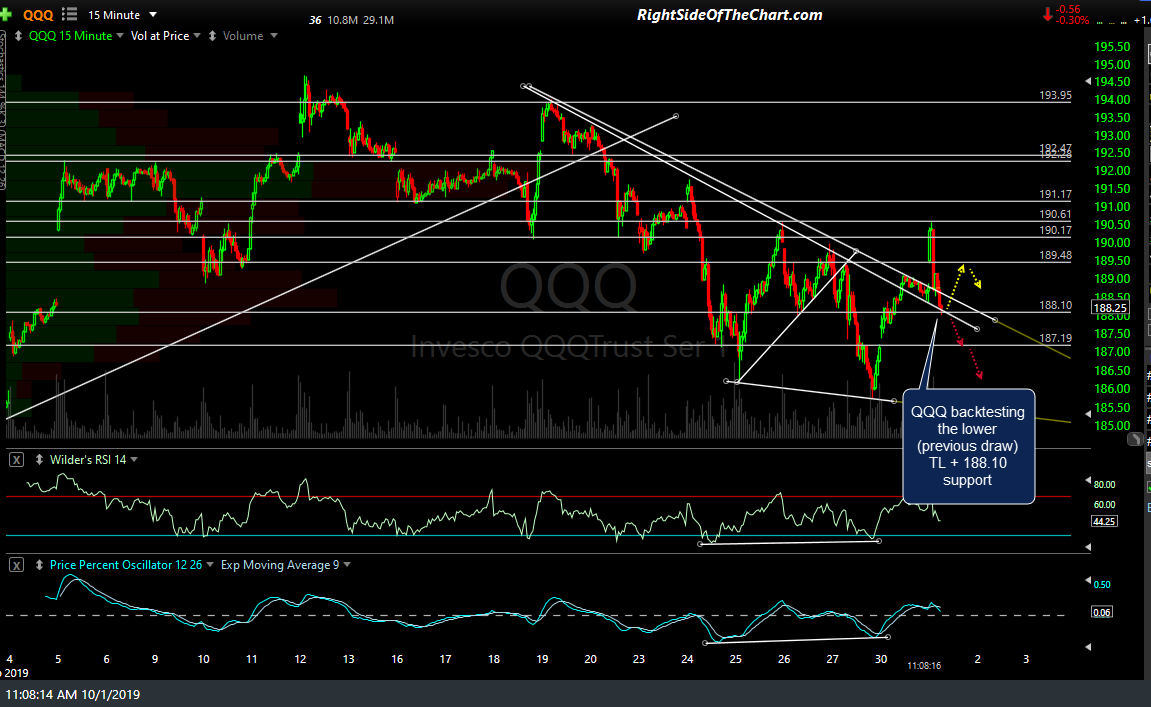
- At the time of recording, QQQ was backtesting the 15-60-minute downtrend line with the 188.10 support level just below (and currently being tested as I type with QQQ slightly below the upper-most TL while backtesting the lower-most (previous draw) TL), with an objective long entry for a bounce trade down to but not much below that level.
- QQQ, XLK & MSFT are once again testing the key uptrend lines off their Dec 24th lows which means that the stock market remains as little as 1-2% away from triggering a powerful sell signal although support is support until & unless broken.
- /NG and UGAZ could trigger a short-term buy signal on an impulsive break above the 60-minute minor downtrend line.
- Gold & Silver continue to rally of the support levels that were hit yesterday (and again today on /GC) while breaking out above the 60m downtrend lines to trigger the next objective long entries.
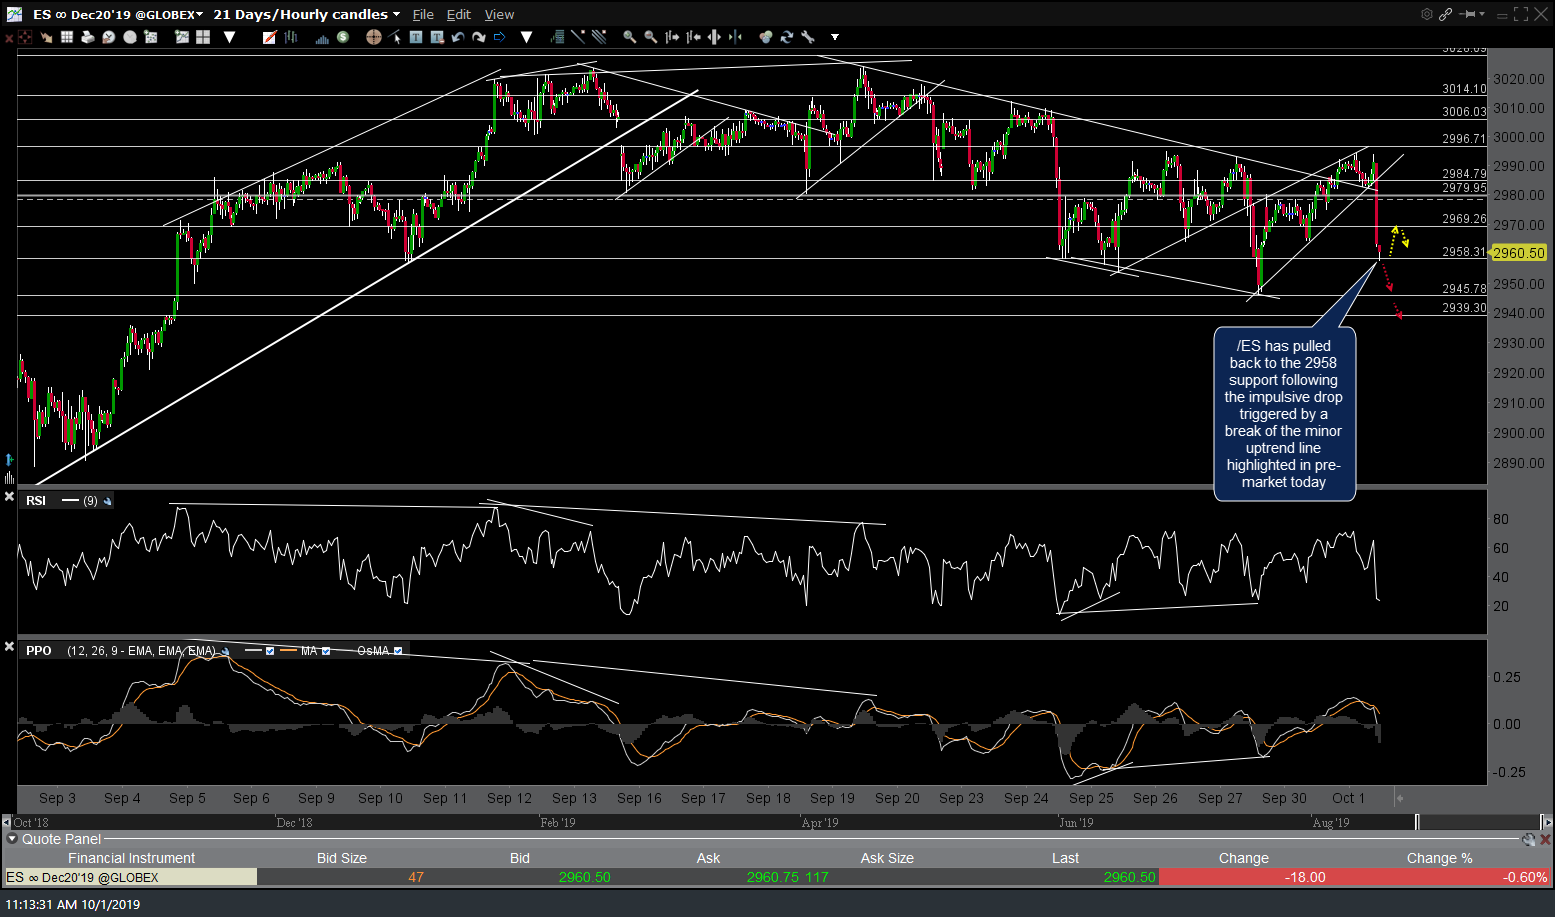
- QQQ & /ES 60-minute charts are posted below the video.
playback speed can be increased in the settings to reduce video duration
-

- QQQ 15-min 2 Oct 1st
-

- ES 60m 2 Oct 1st