
I forgot to include the charts of the major stock index futures in my previous update, including the fact that both /ES (S&P 500) and /NQ (Nasdaq 100) have negative divergence on the 60-minute charts. The white arrows on the charts below show how divergent highs are typically followed by corrections. I’ve also included some minor uptrend lines that could spark the next leg down with the same levels that acted as resistance on the way up, including the downtrend lines, now likely to come into play as support/price targets.
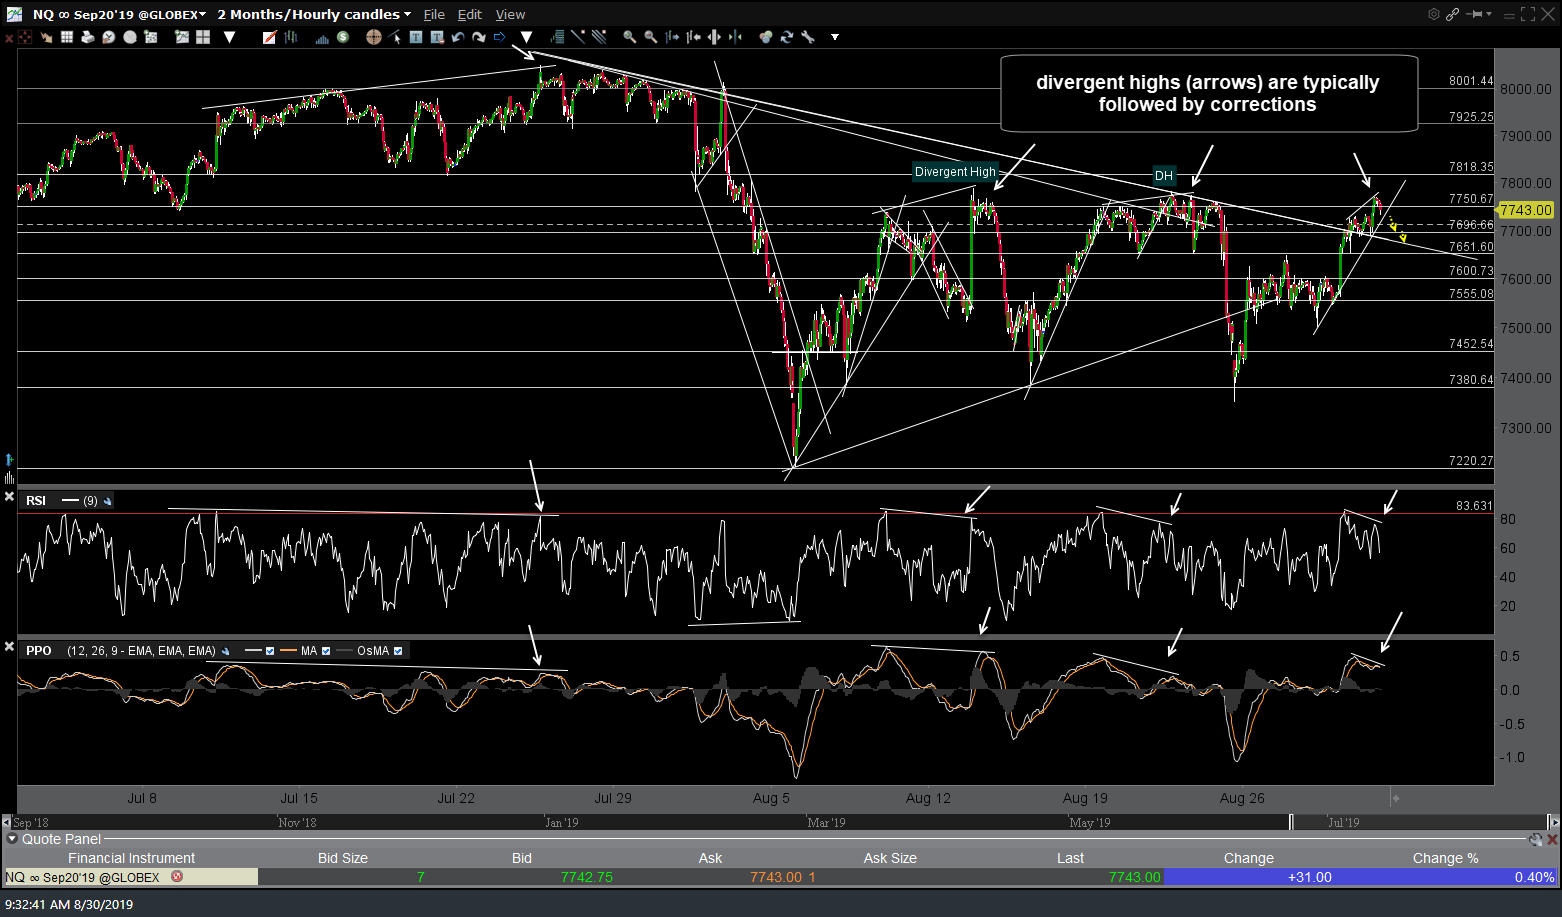
NQ 60-min Aug 30th
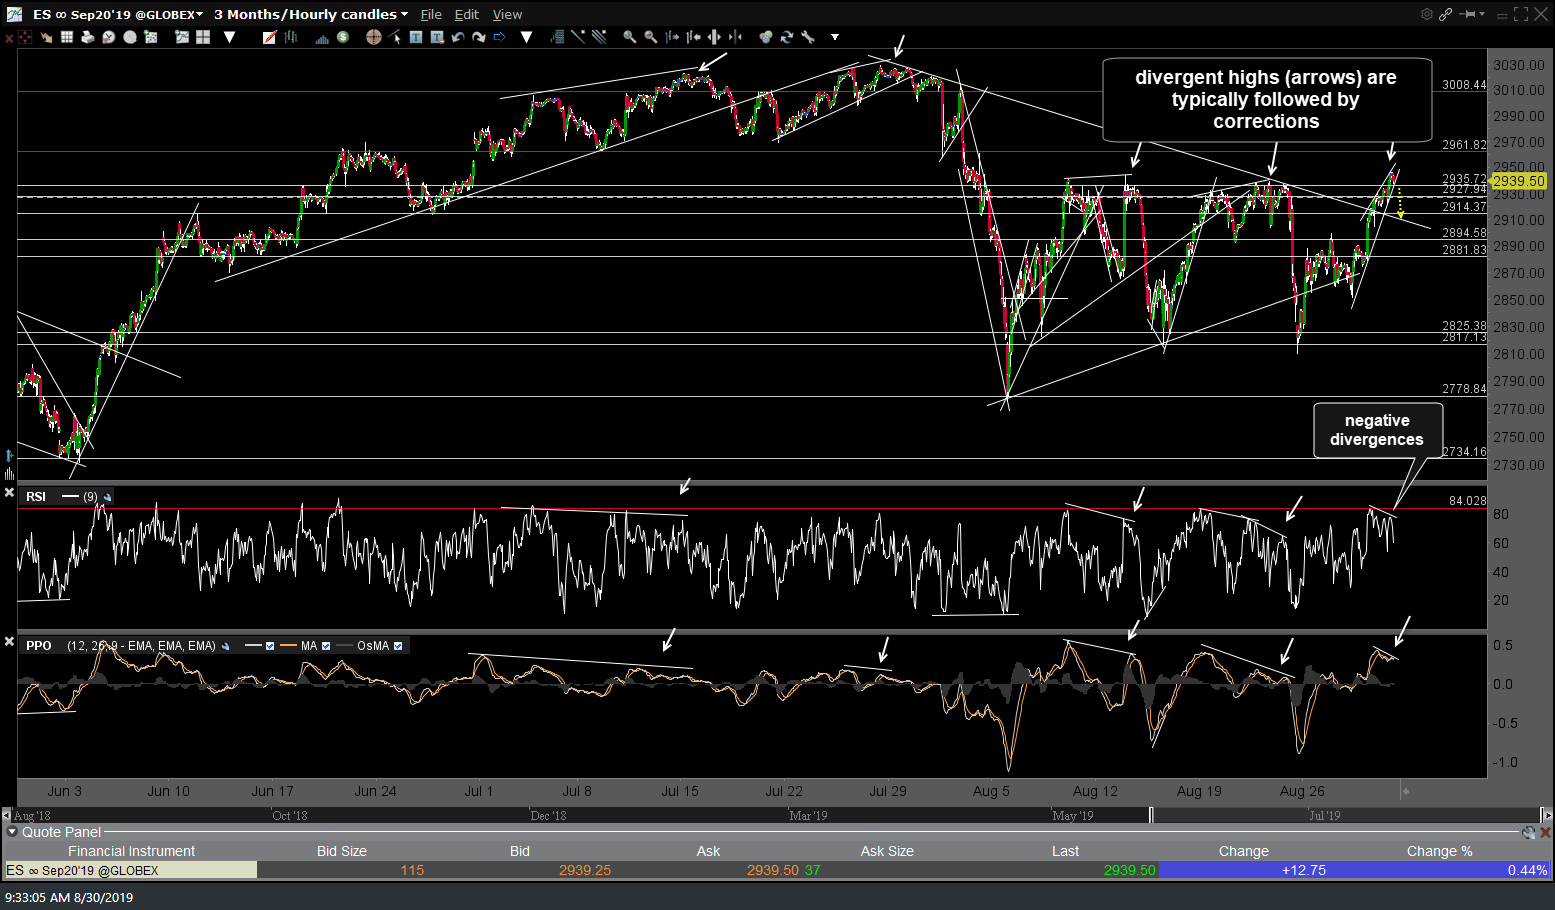
ES 60-min Aug 30th