
Sell signal to come on a solid break & 60-minute close below the rising wedges on QQQ & SPY with a minimum target of a backfill of Monday’s gap (the first of QQQ or SPY to backfill the gap). 60-minute charts below.
-
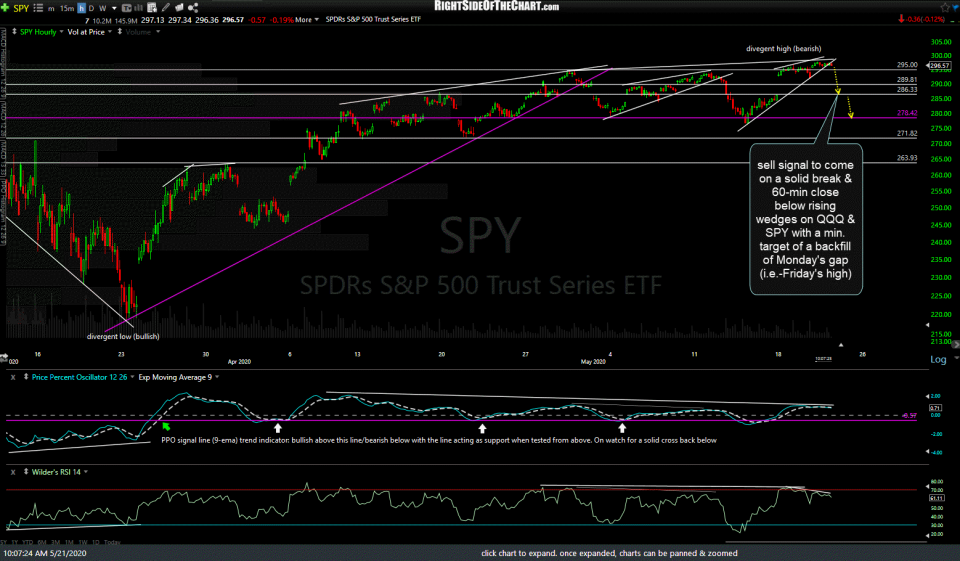
- SPY 60m May 21st

-
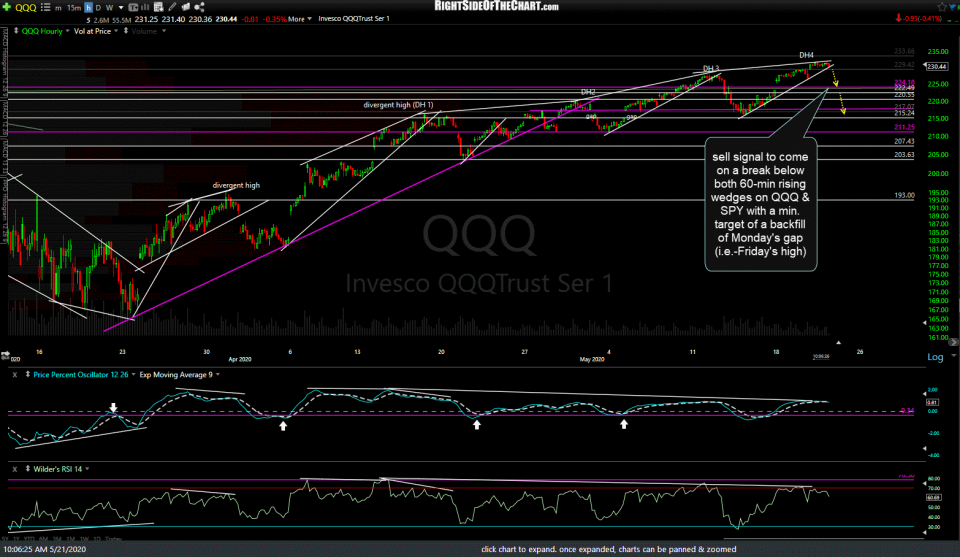
- QQQ 60m May 21st

Looking at the 60-minute charts of the index futures, /NQ (Nasdaq 100) is backtesting the rising wedge (yellow) from below following a non-impulsive breakdown with this marginal new high extending the existing divergences. Likewise, negative divergences remain intact on /ES (S&P 500) with any equal or marginal new high on soon to extend those existing divergences. The PPO signal line has been backtesting & bouncing off the zero line while a solid break below would indicate a trend change. 60-minute charts below.
-
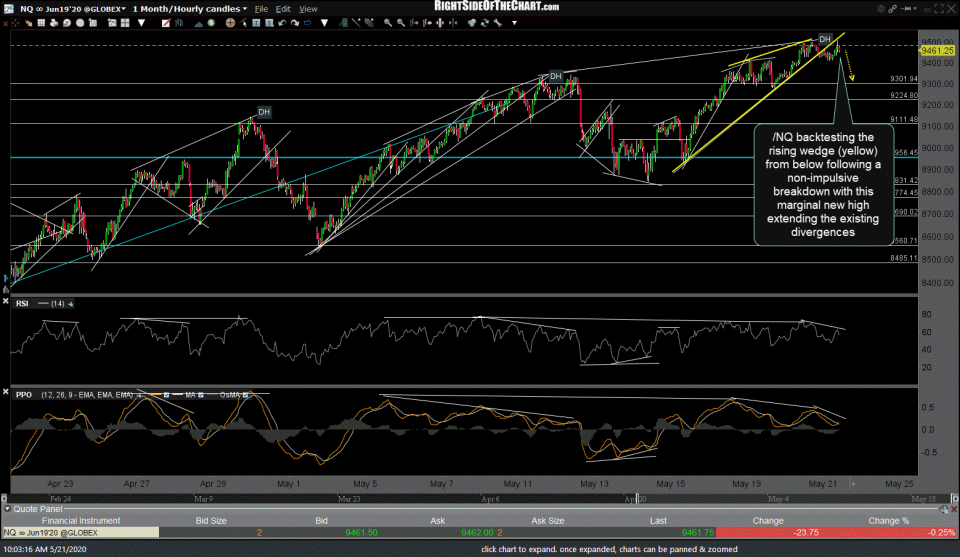
- NQ 60m May 21st

-
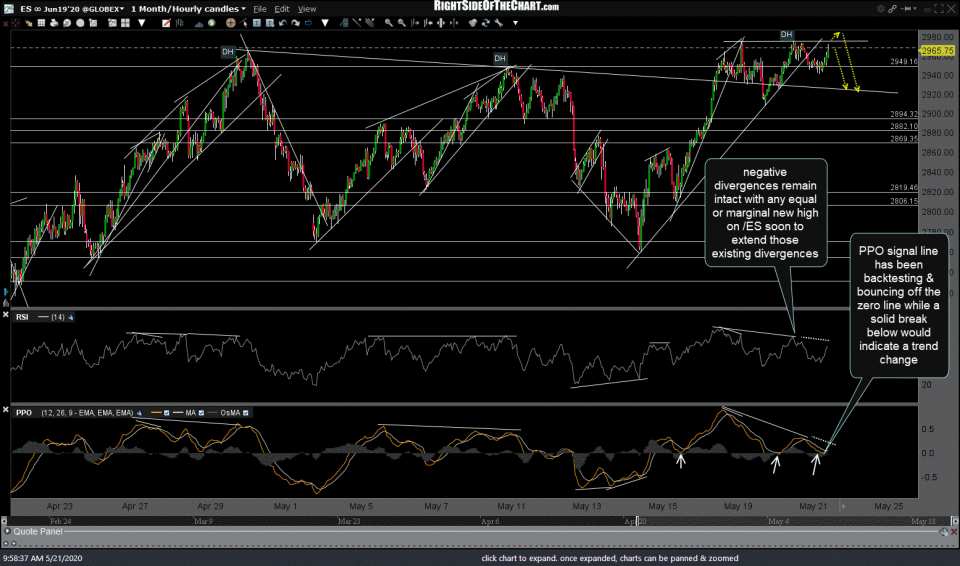
- ES 60m May 21st

Note: multiple charts in a gallery format, such as in this post, will not appear on the email notifications but may be viewed on the site.