
The positive divergences on these 15-minute charts of NQ (Nasdaq 100 futures) and /ES (S&P 500) could be the catalyst for the next counter-trend rally before the next major leg down.
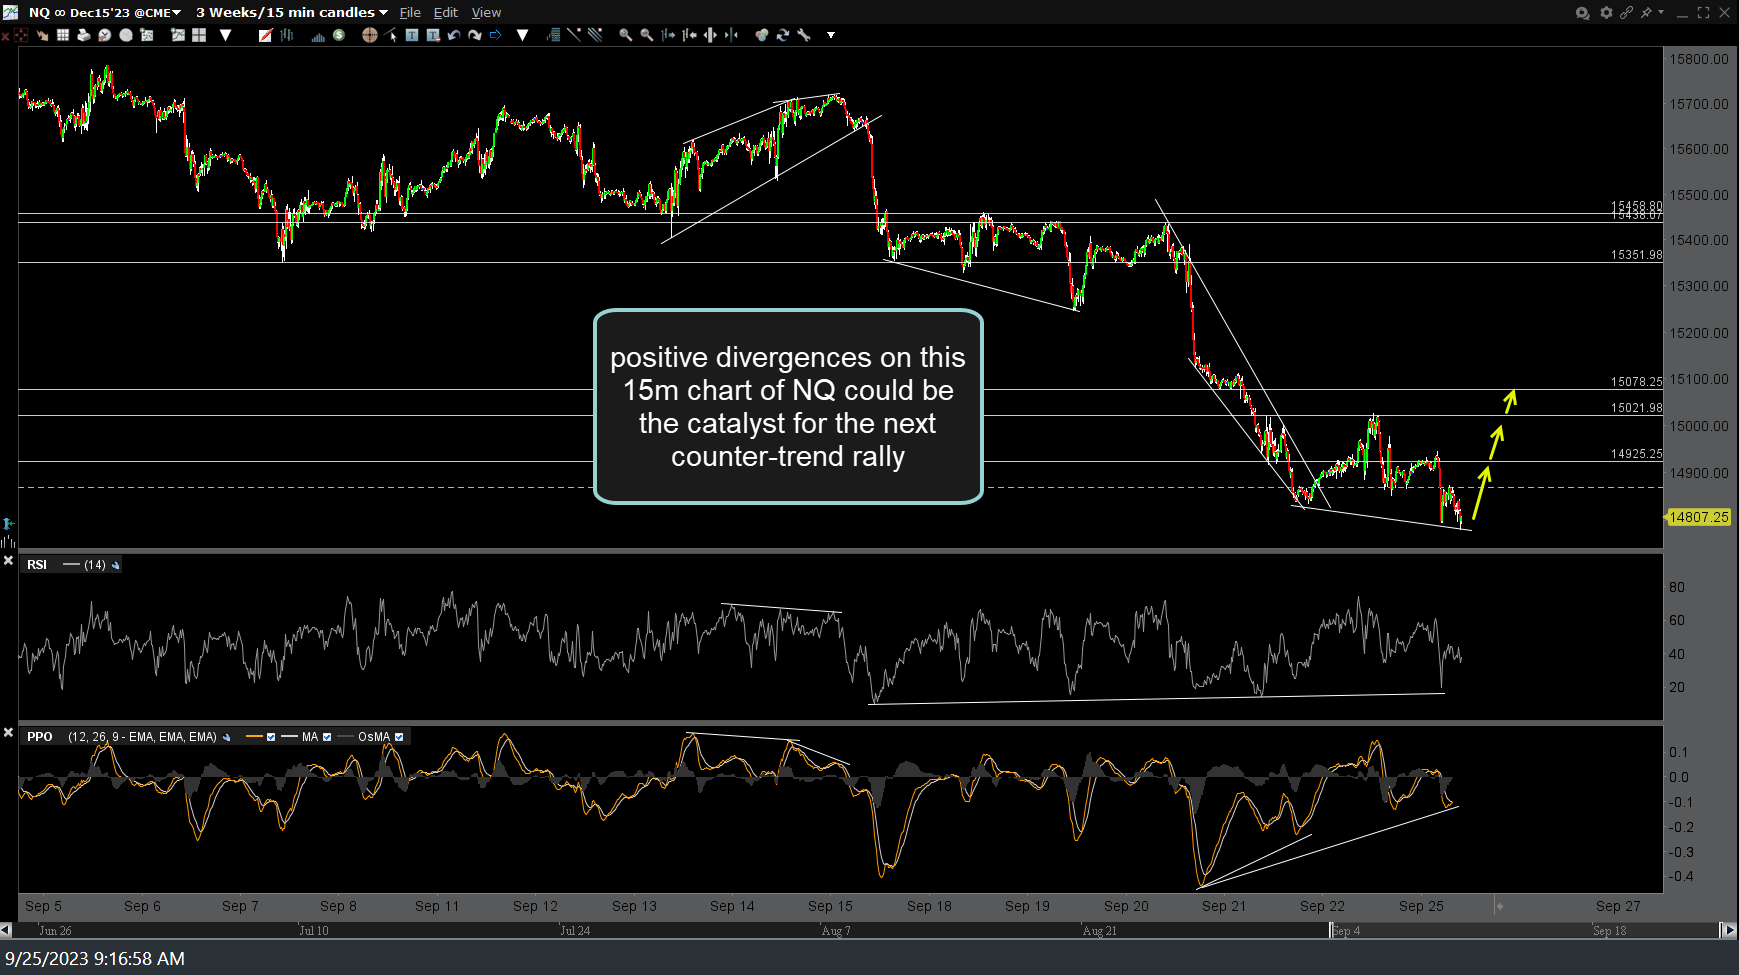
NQ 15m Sept 25th
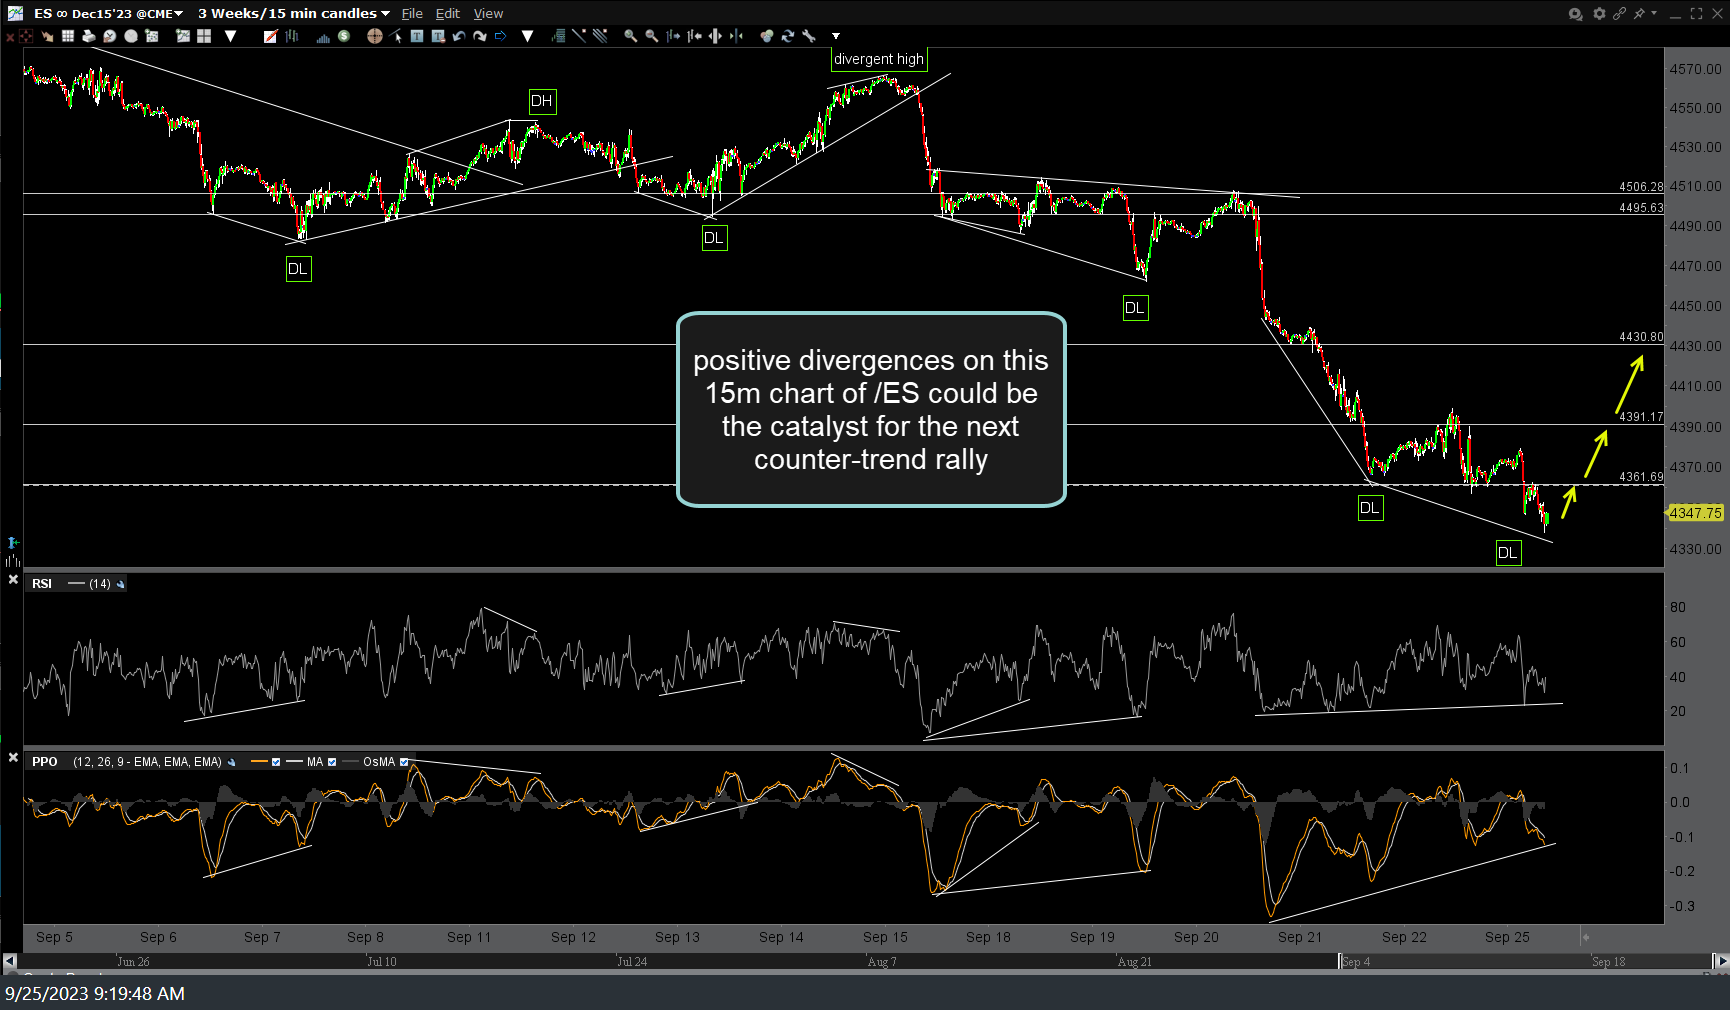
ES 15m Sept 25th
Zooming out to the daily time frame, QQQ is currently trading a hair above T1 (first target & price support) in the pre-market session, increasing the odds for a reaction/bounce today and/or early this week. Bounce or no bounce, the next major sell signal will come on a solid break and/or daily close below T1.
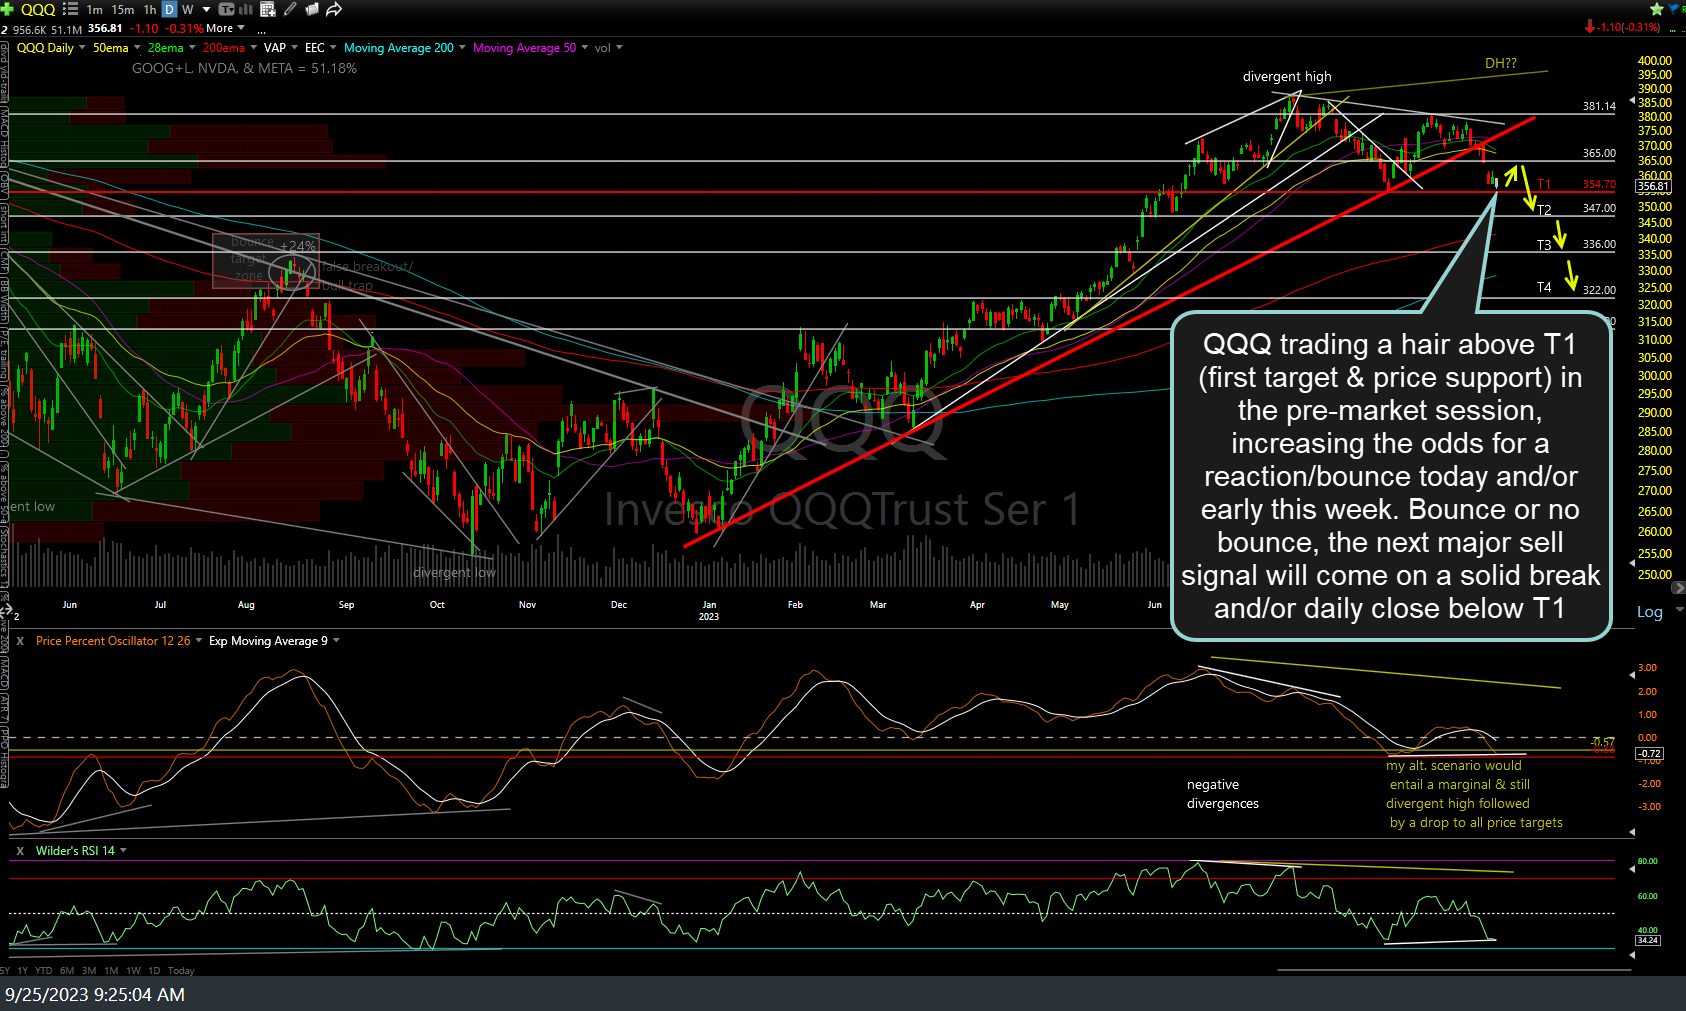
QQQ daily Sept 25th
Additionally, /NQ is currently testing the key Aug 18th reaction low (potential support) with potential divergences building on the indicators on the 60-minute time frame, thereby increasing the odds of a tradable bounce until & unless this support level & the divergences are clearly taken out (not just a brief whipsaw drop below followed by a recovery back above).
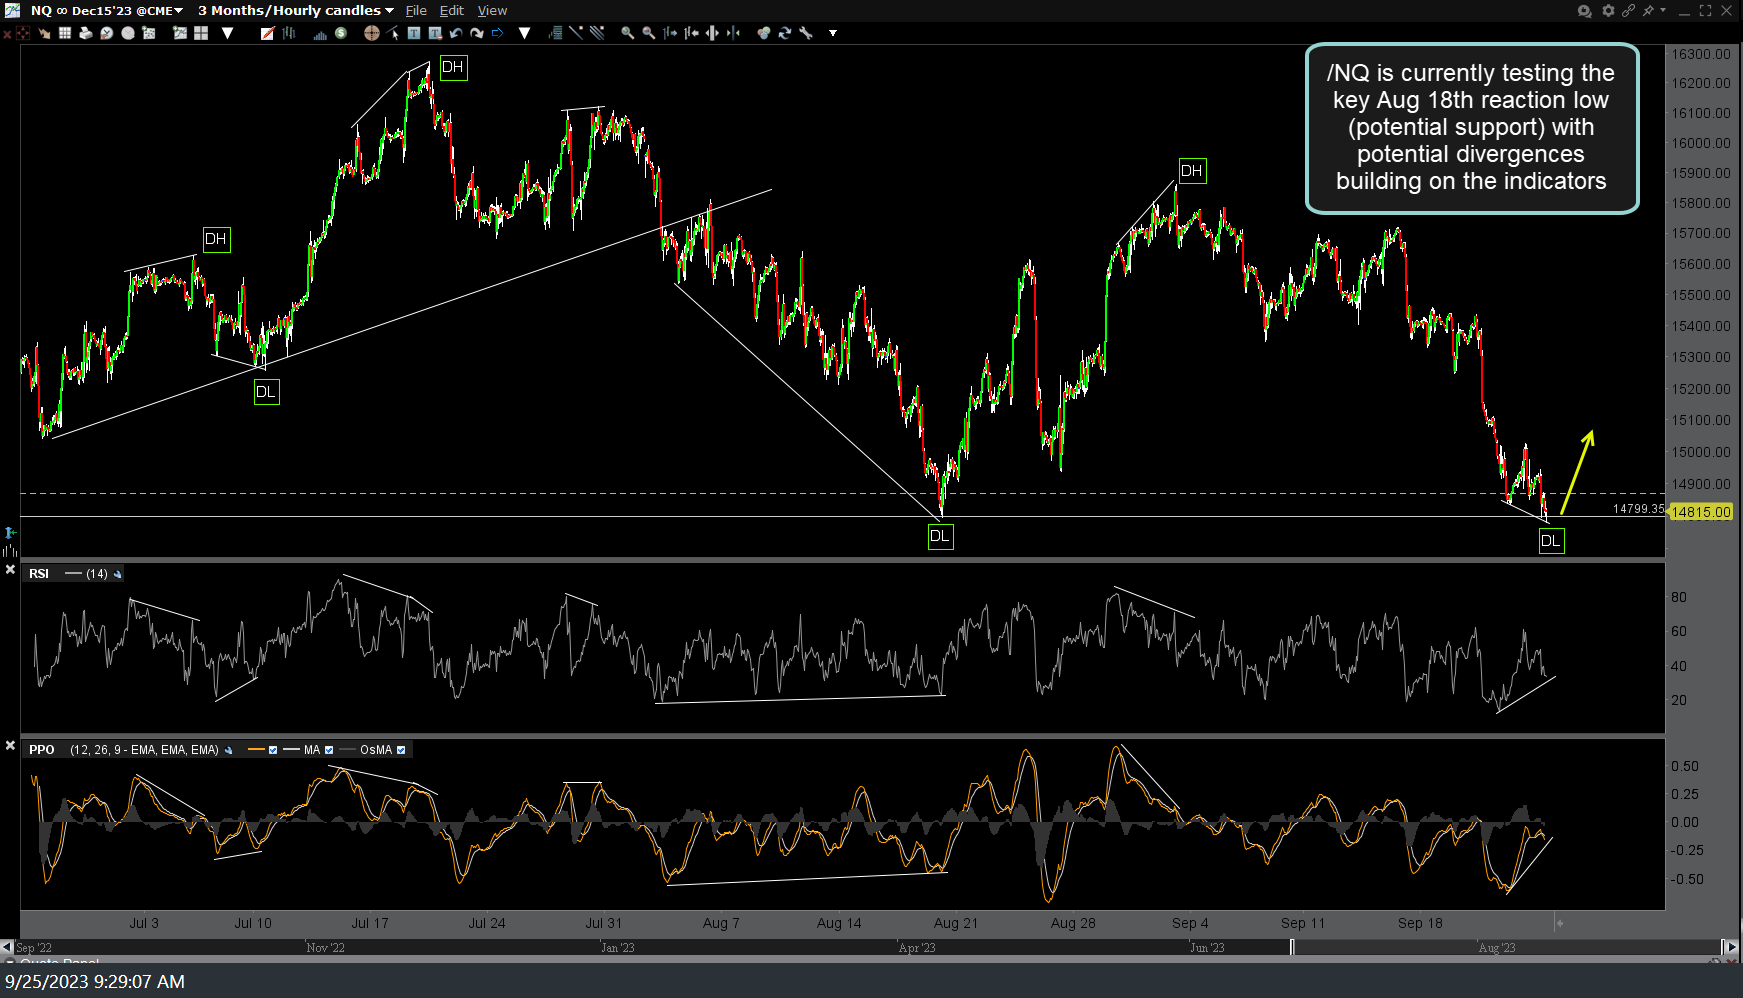
NQ 60m Sept 25th