
This stark divergence between the stock market (SPY in white) and junk (aka- high-yield) bonds since Oct 29th is a potential red flag for equities & something worth monitoring going forward for either continued divergence (bearish) or abatement (junk bonds start to rally along with equities).
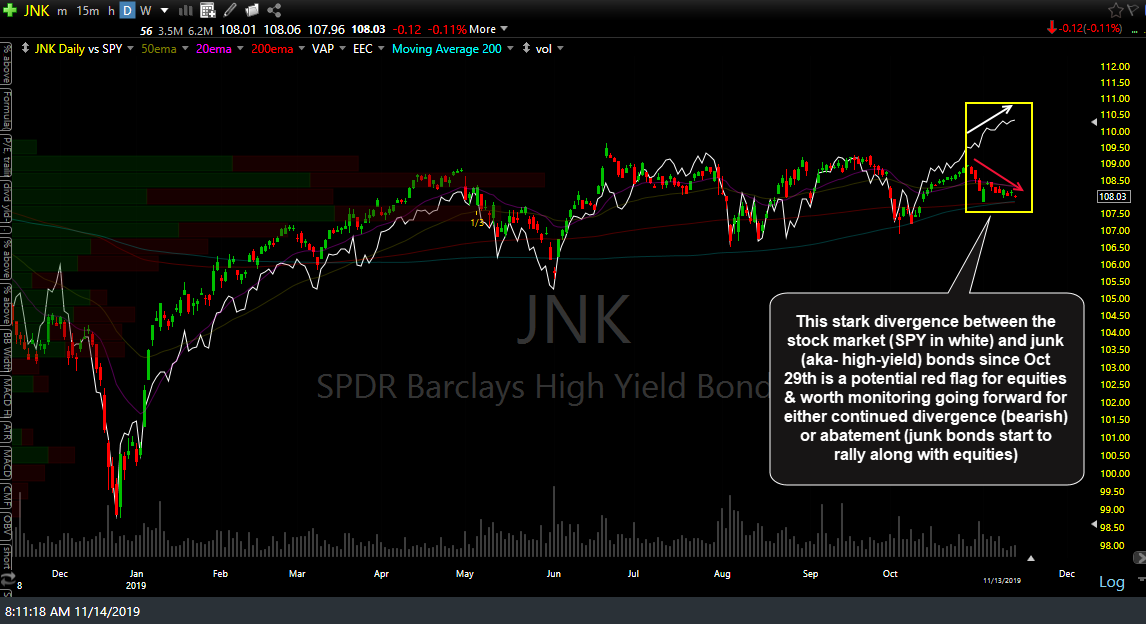
JNK vs SPY Nov 13th close
Although bonds are a completely different asset class than equities (stocks) and tend to move with an inverse correlation with the stock market, all bonds are not created equal. The typically inverse correlation between stocks & bonds that I had mentioned when discussing asset allocation in yesterday’s video generally refers to the relationship between the stock market and investment-grade (US Treasuries & high-quality corporate) bonds.
The relationship between investment-grade bonds & the stock market is fairly straight-forward: When expectations of future economic growth are bullish, stocks rise on the expectation of earning growth & bonds fall for several reasons:
- Economic growth typically results in higher inflation/interest rates as prices of goods, services, wages, etc.. rise (historically speaking, massive QE & artificially low rates have distorted many of the historic norms in recent years). Investment-grade bond prices trade inversely to interest rates: Rising rates = falling bond prices & vice versa.
- When investors are bullish on the outlook for the stock market, they tend to migrate away from relatively low-yielding investment-grade bonds to seek higher returns via stocks and vice versa (moving from stocks to bonds) when the economic outlook worsens.
- Investment-grade bonds & particularly US Treasury bonds are one of the primary “flight-to-safety” assets where investors, particularly institutional investors such as pension plans, hedge funds, etc.. will flock both during and before (in anticipation of) turmoil in the financial markets. The flight-to-safety trade is a two-way street (flight to and/or from safety) as the real and/or perceived risks in the stock market ebb & flow.
High-yield bonds, aka “junk” bonds, are corporate bonds with below investment grade ratings from the major credit agencies (below BBB rating from S&P and below Baa from Moody’s). Essentially, junk bonds pay a much higher rate than the more secure investment-grade bond to compensate investors for the additional risk they are taking. Issuers of high-yield bonds tend to be startup companies or capital-intensive firms with high debt ratios.
Although in principle, both investment grade & high-yield bonds promise to pay back the principal when the bond reaches maturity, as well all know, an I.O.U. or promise to pay back a loan is only as good as the person, or in this case, the company making it. As such, when the economy is humming along (i.e.- we are in an economic expansion), default rates on junk bonds are relatively low. However, due to the precarious fundamental/financial position of those companies (e.g.- high debt servicing loads, unstable cash flows, etc.), once the economy starts to slow & especially when it begins to contract, default rates on junk bonds begin to rise & at times, can rise very rapidly.
The net result is that unlike investment-grade bonds, in which prices are primarily affected by the aforementioned factors & tend to trade inversely or with very little correlation to the stock market, junk bonds have a very high correlation to the stock market & in fact, nearly mirror the stock market again, due to the aforementioned conditions (their pricing is much more sensitive to economic conditions & future expectations due to the potential default risk while they are much less affected by changes in interest rates).
The take away from all of this is the fact that savvy investors will monitor the bond market for any irregularities that might provide clues as to some potential caution signs such as a recent & steady rise in Treasury bond prices that is not attributed to change in interest rate expectations (as that might indicate a likely flight-to-safety bid from institutions moving money from stocks into the safe-haven of T-bonds because the ‘smart money’ sees something concerning that the rest of the herd doesn’t yet see). Likewise, a clear shift from the very tight positive correlation between the stock market & high-yield bond market, such as the recent one highlighted in the chart above, may also tell us that all is not as well as the stock market would seem to indicate.
I will say that although junk bond prices are much more affected by changes in the current or future expectation of macro-fundamentals vs. changes in interest rates, as fixed-income debt instruments, they are not completely immune to changes in interest rates and we did recently have a fairly sharp rise in mid-to-longer-term rates (e.g.- LQD, IEF & TLT) which would most likely account for at least some of the recent pullback in high-yield bonds.
With that being said, the recent divergence between SPY & JNK is quite stark & as can be seen on that chart above, it is clearly the most pronounced & longest divergence between junk bonds & the stock market in at least the past year. As such, I believe this is something worth monitoring going forward as a resumption of the positive correlation would certainly help to support the intermediate-term bullish case for the stock market while continued divergence would not.