
/ES (S&P 500 futures) has been trading on the 3900ish support since yesterday with a solid break below likely to spark another wave of selling down to the 3850ish level. 60-minute chart below.

ES 60m March 19th
/NQ (Nasdaq 100 futures) has been bouncing between the 12704ish target/support & 12925 former support, now resistance level with a sell signal to come on a solid break below 12700. 60-minute chart below.
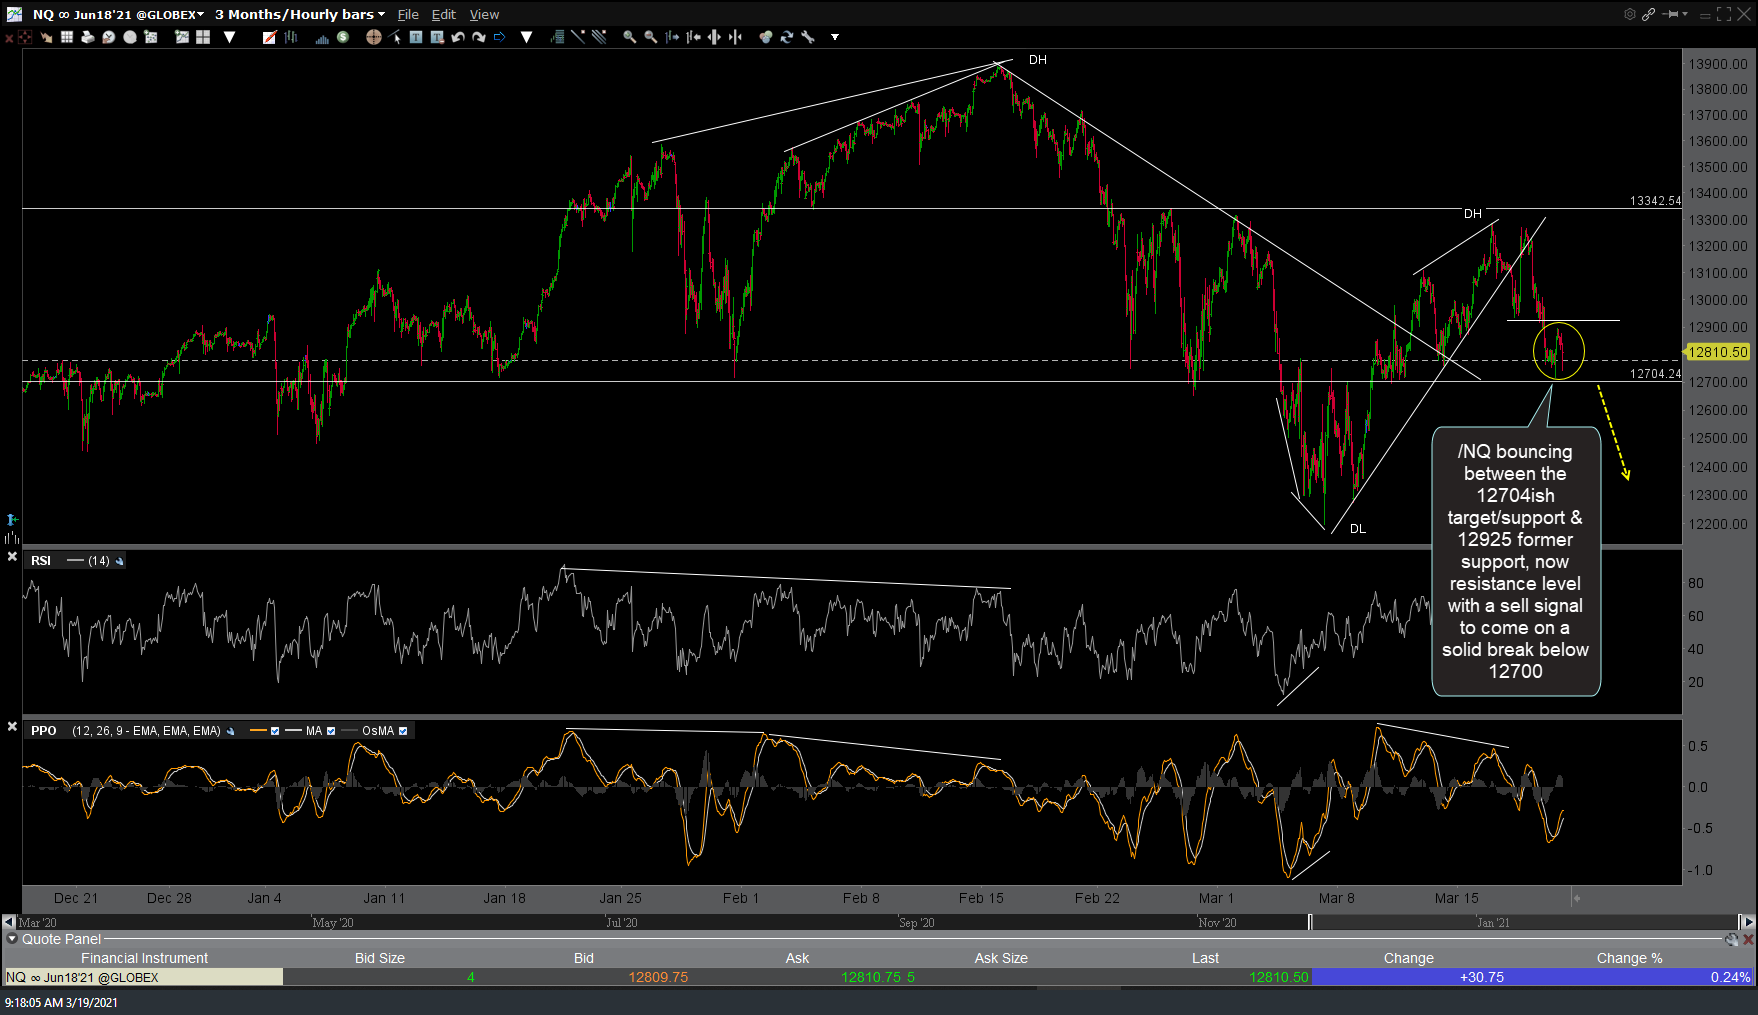
NQ 60m March 19th
/RTY (Russell 2000 Small-Cap futures) has been trading on the T1 level since hitting it yesterday with another sell signal to come on a solid break below the recent lows.
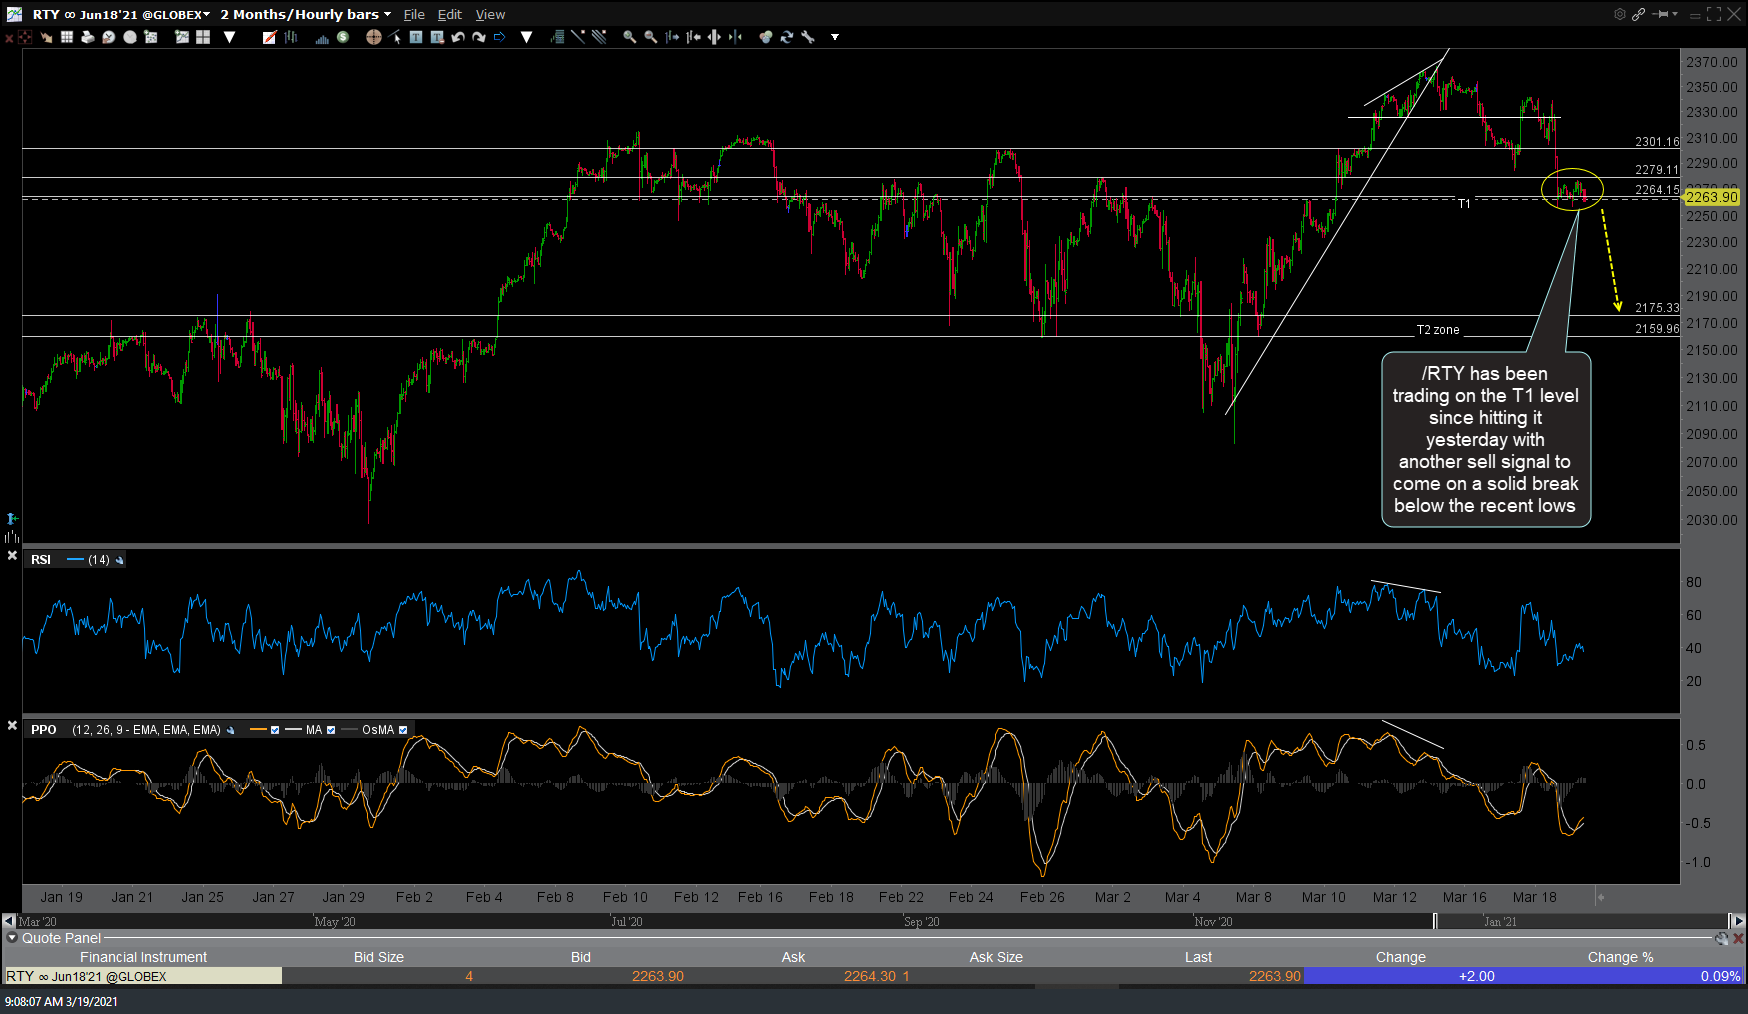
RTY 60m March 19th
The reaction off the initial tag of the bottom of the T2 zone took /CL (crude oil futures) back to T1 (now resistance) with the next sell signal to come on a break below yesterday’s low. 60-minute chart below.
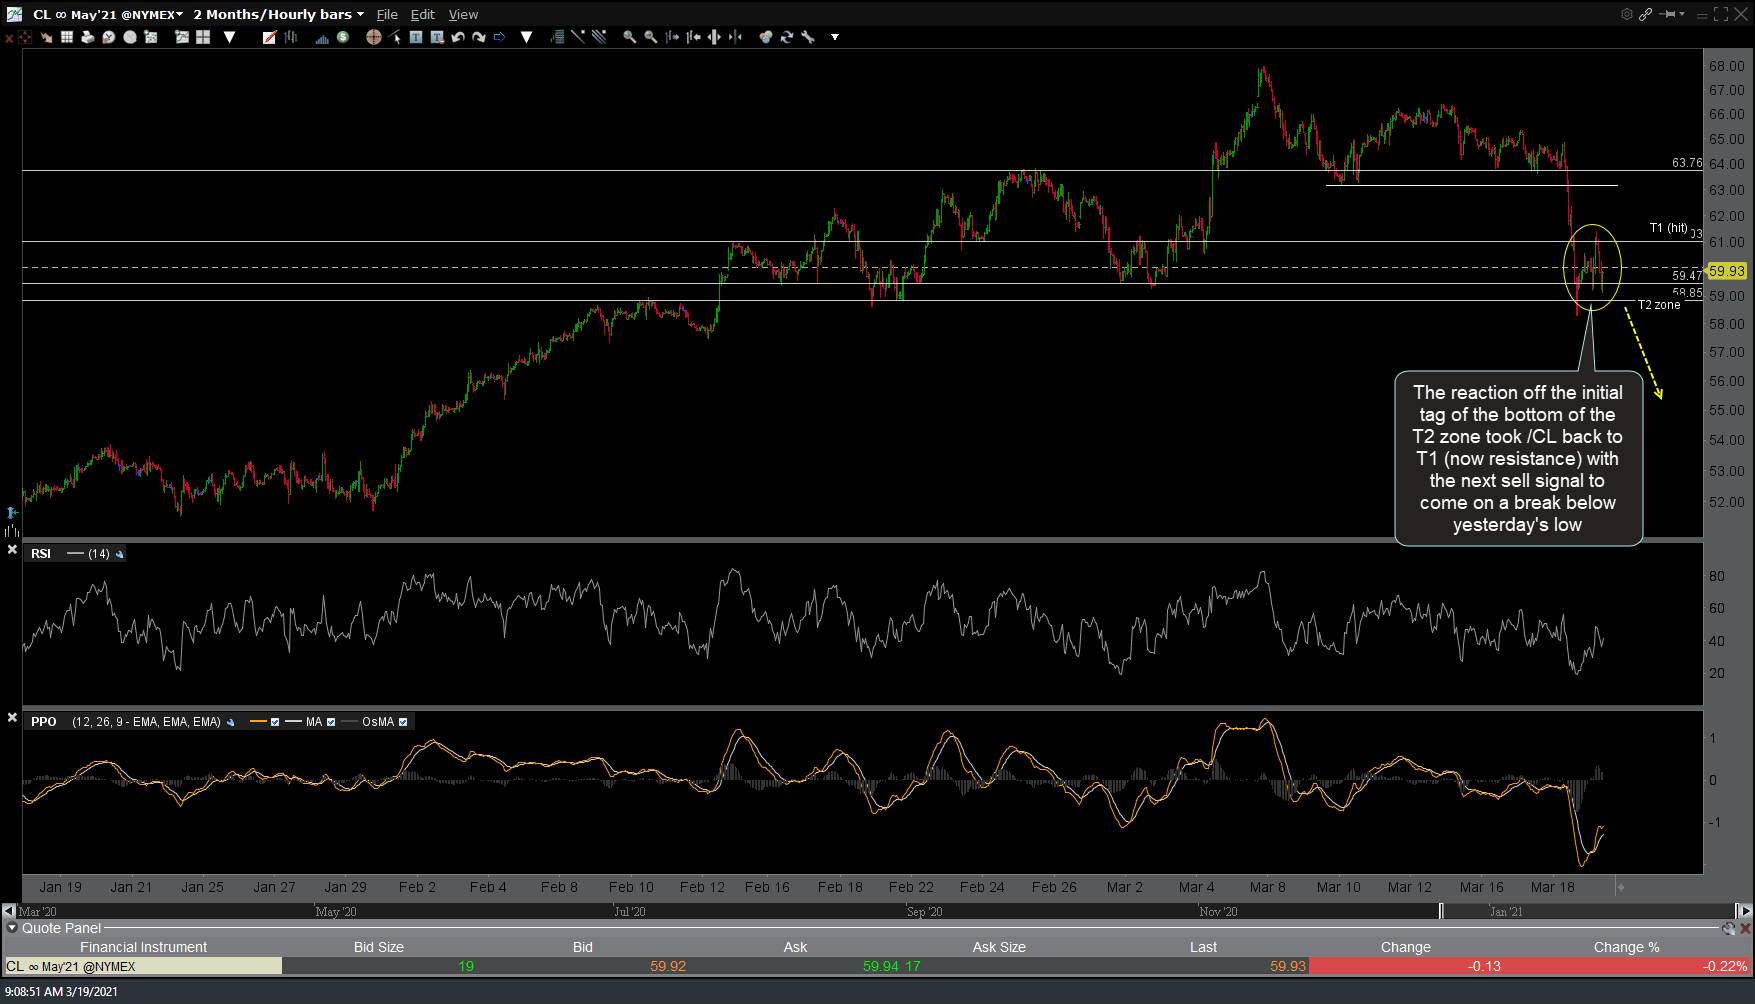
CL 60m March 19th
The next downside target on /CL if yesterday’s low is taken out would just above the 57.25 support on this 120-minute chart.
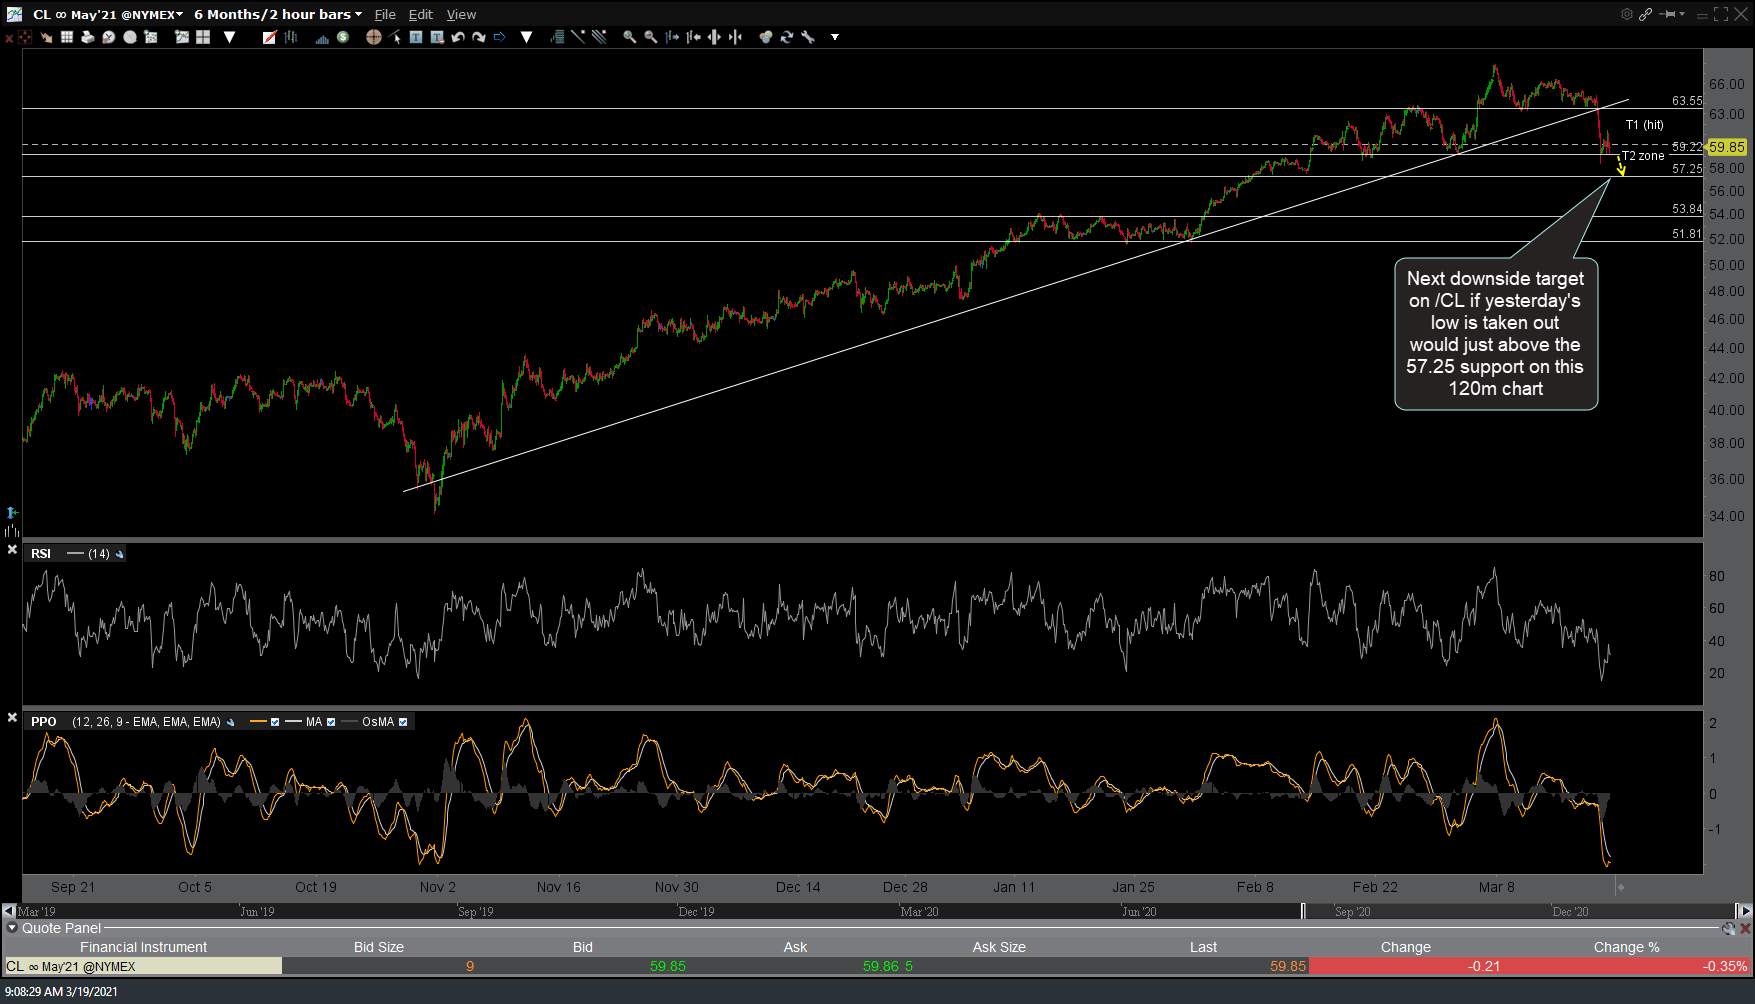
CL 120m March 19th