
In lieu of a video, here’s a quick look at the 60-minute charts of the S&P 500 & Nasdaq 100 tracking ETFs & futures. As anticipated, once SPY impulsively entered yesterday’s gap from above (shortly before the close), it was quickly backfilled. Next sell signal to come on a solid break below the bottom of the gap (283.90ish).
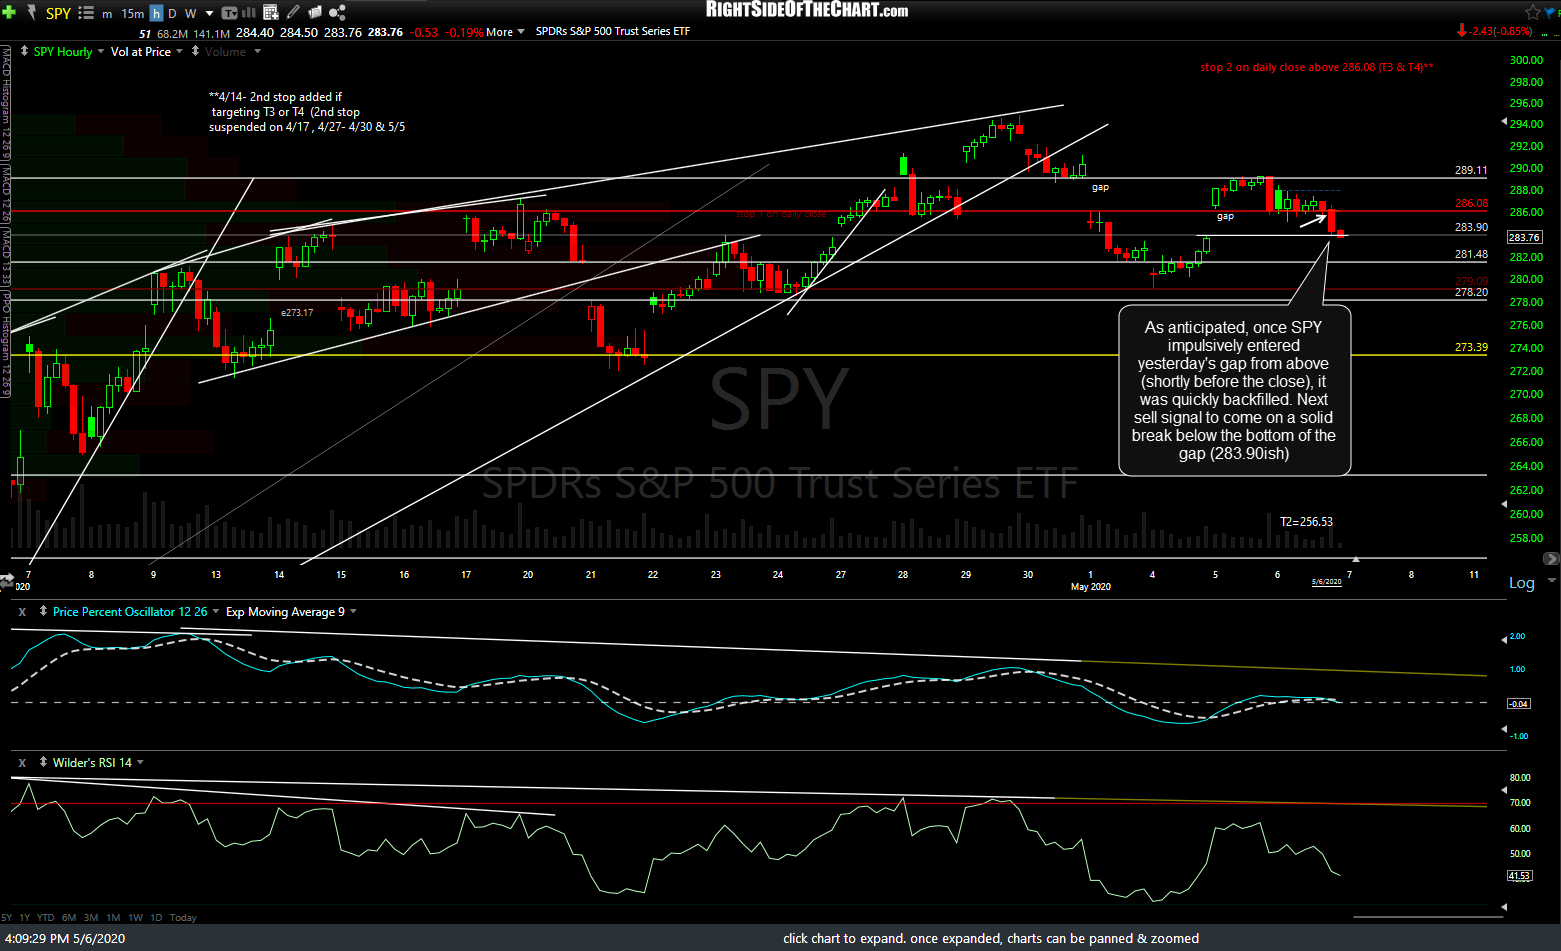
SPY 60m 2 May 6th
Today’s marginal new high in QQQ extended the negative divergences that were already in place, setting the stage for what could be an even larger drop if/when those divergences play out for a trend reversal soon. Next sell signal to come on a solid break below the top of this dual gap support level.
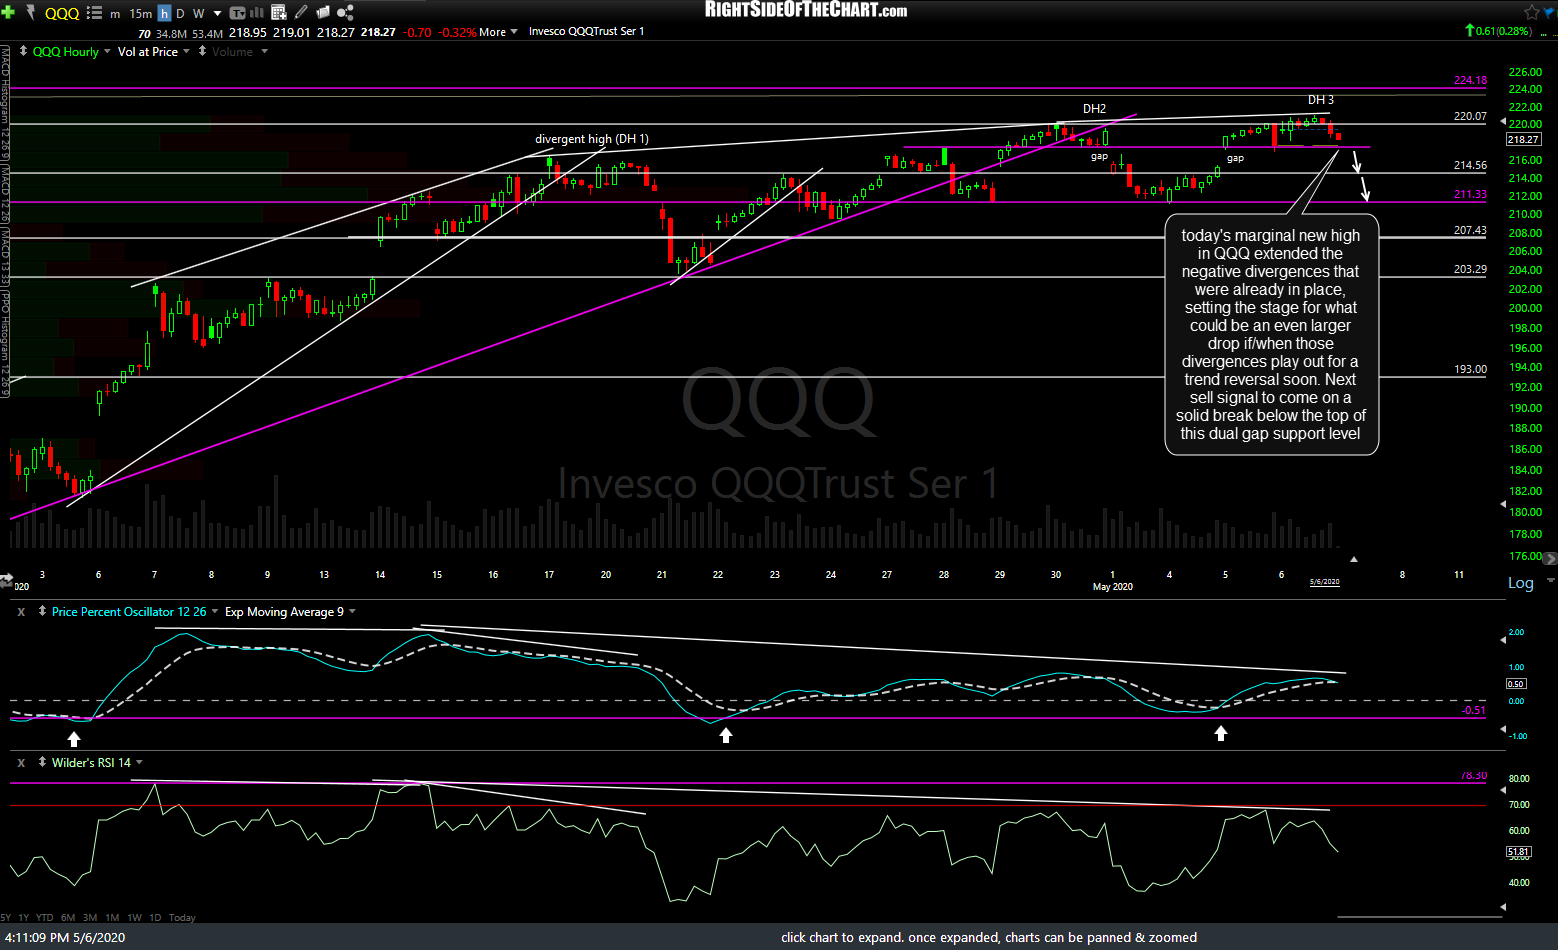
QQQ 60m May 6th
/ES (S&P 500 E-mini futures) effectively put in a divergent high (a nearly-equal high with lower highs on the indicators) with yet another failure at the key 2882.75 resistance level followed by a sell signal with the breakdown, backtest & impulsive drop below the minor uptrend line.
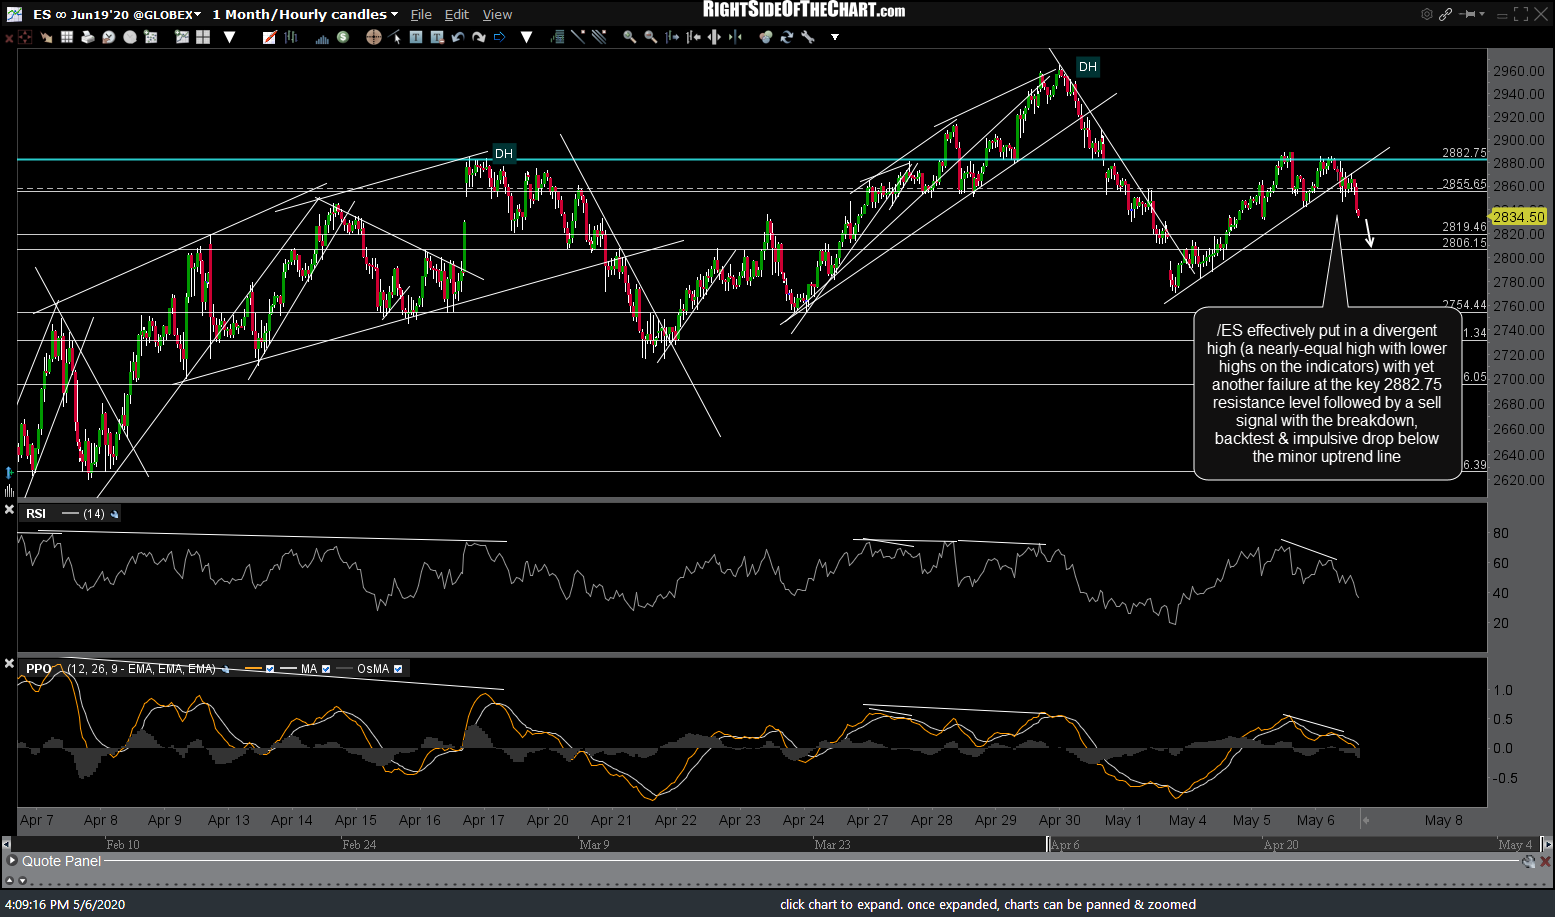
ES 60m May 6th
YADH (yet another divergent high) on /NQ (Nasdaq 100 futures). Unlike the previous divergent high which was followed by a correction, this time around, /NQ has the potential to be a lower high (below the previous key reaction high/divergent high), which could indicate the early stages of a new downtrend. While /NQ did break down below this small rising wedge late in the session today, a solid break below the 8956ish support ‘should’ do the trick.
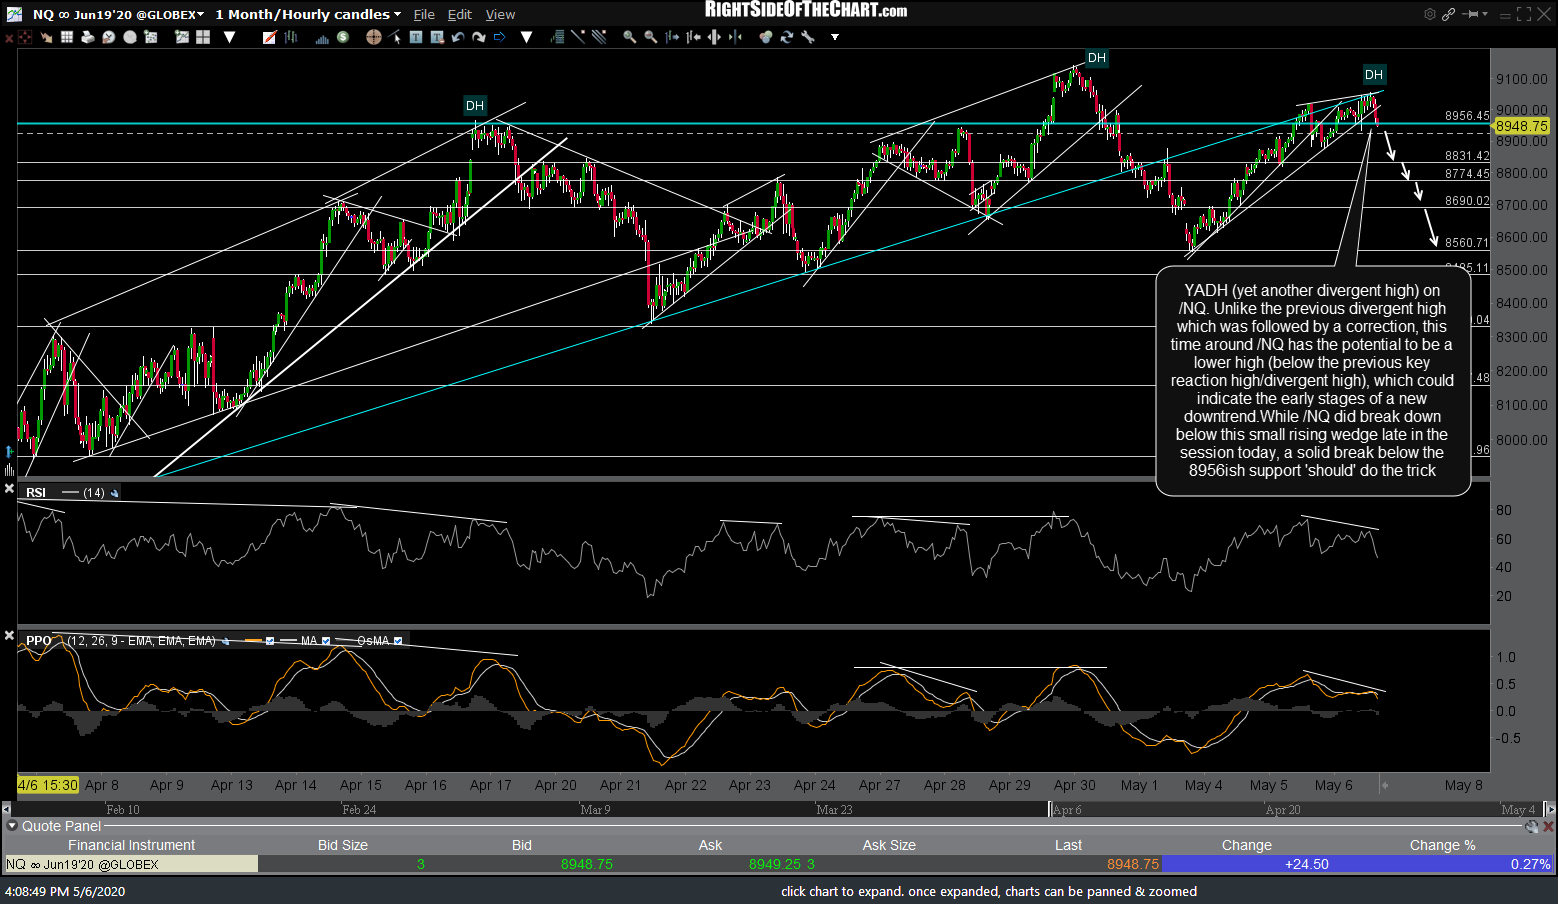
NQ 60m May 6th