
The pending sell signal for /CL (crude oil futures) sell signal from yesterday’s post was triggered on the breakdown below the uptrend line on this 120-minute chart (see 60-minute chart at bottom of this post for “micro” or active trading targets). Previous (yesterday’s) & updated 120-minute charts below.
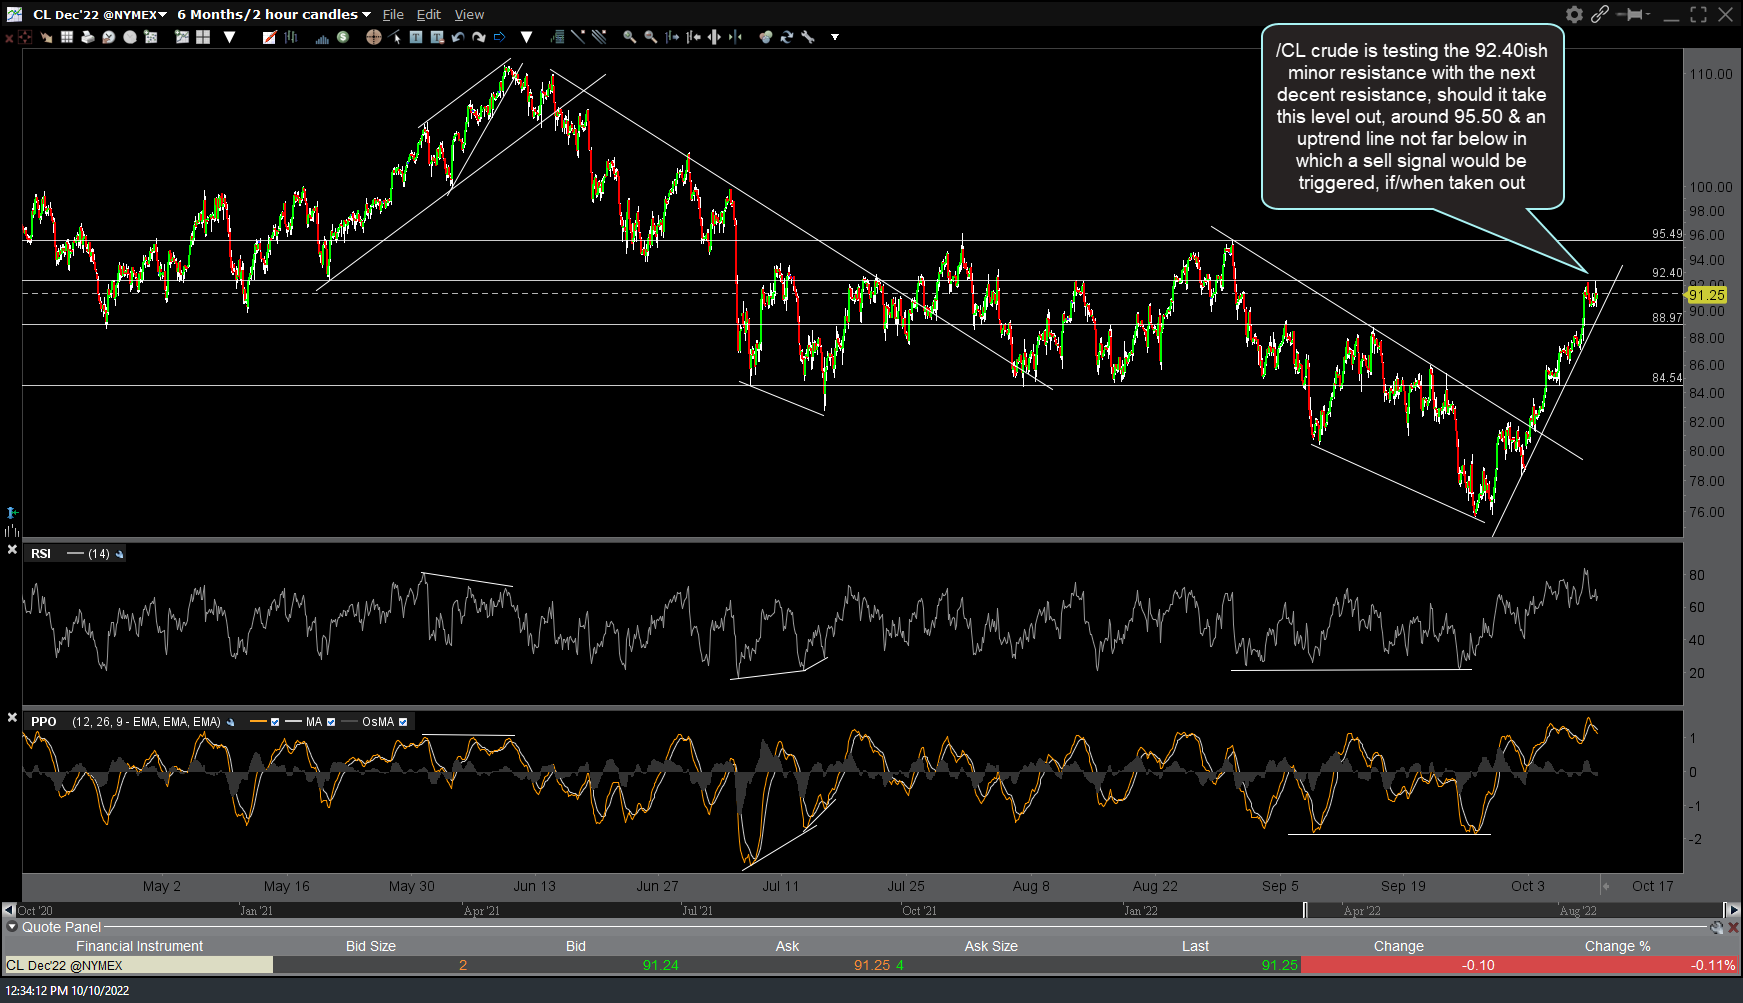
CL 120m Oct 10th
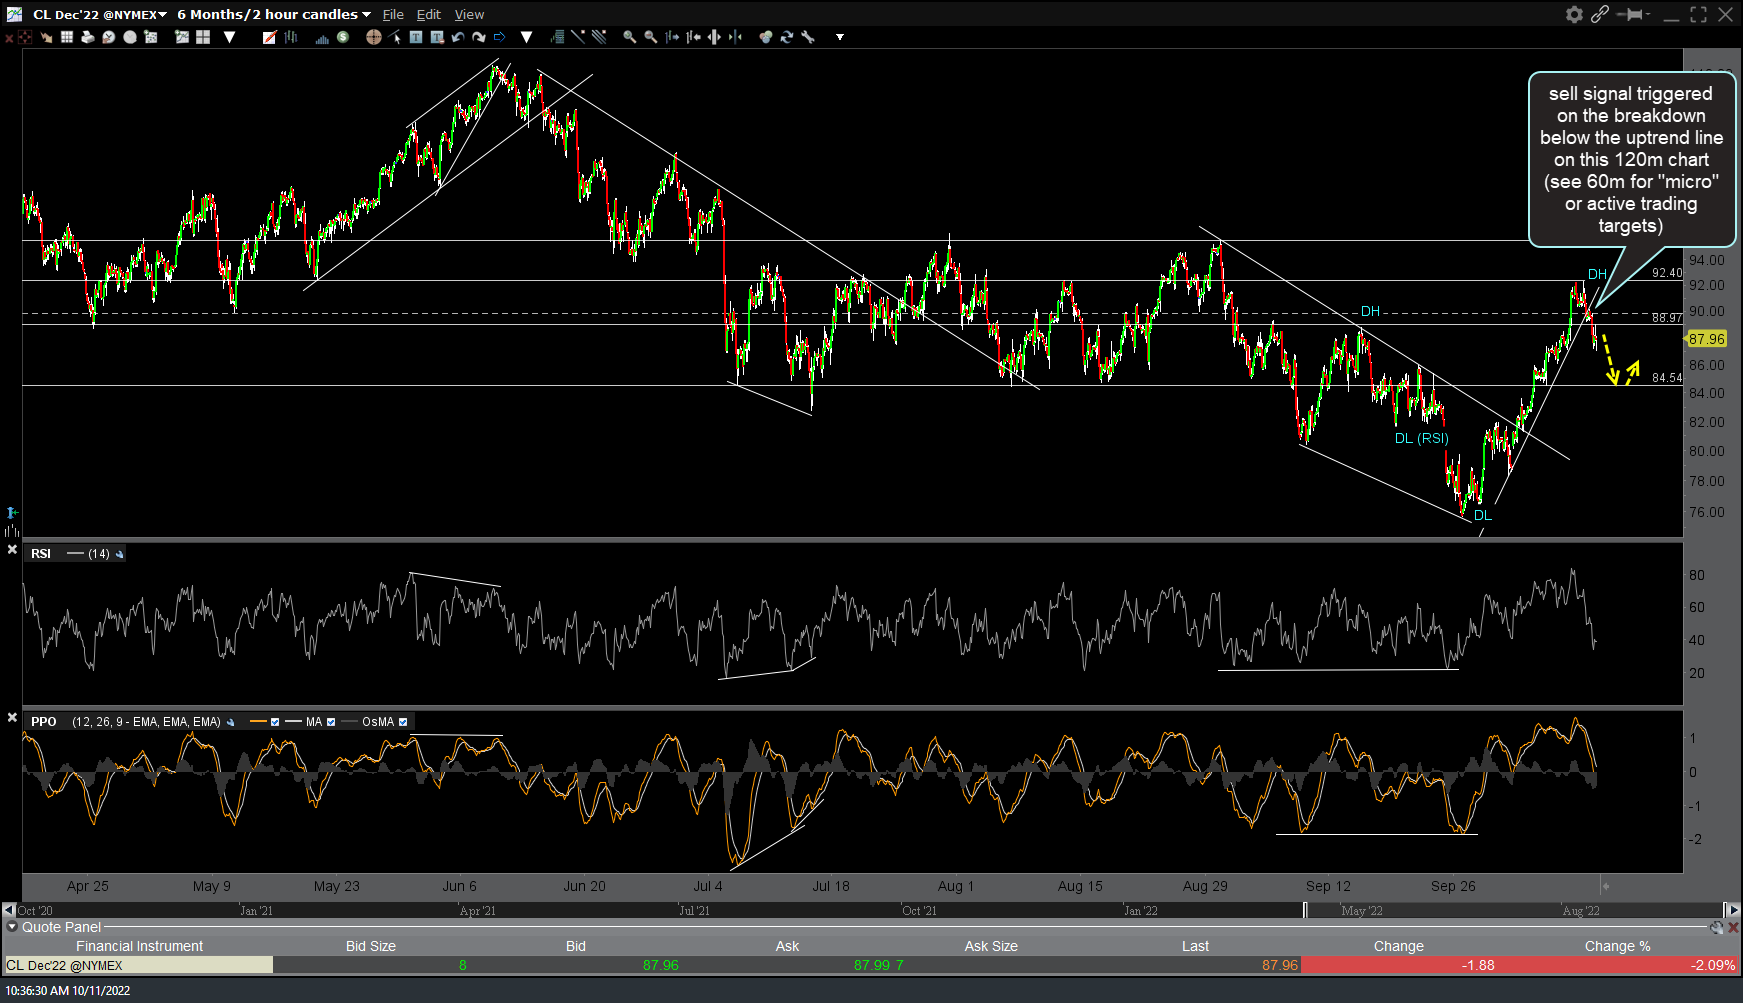
CL 120m Oct 11th
Zooming down to the 60-minute time frame, following the sell signal triggered on the break below the same uptrend line, potential targets are shown at the marked support levels on this 60-minute chart with objective short entries/add-on to come on breaks below each support, ideally after a reaction first, as well as on rallies back into resistance (former support levels).
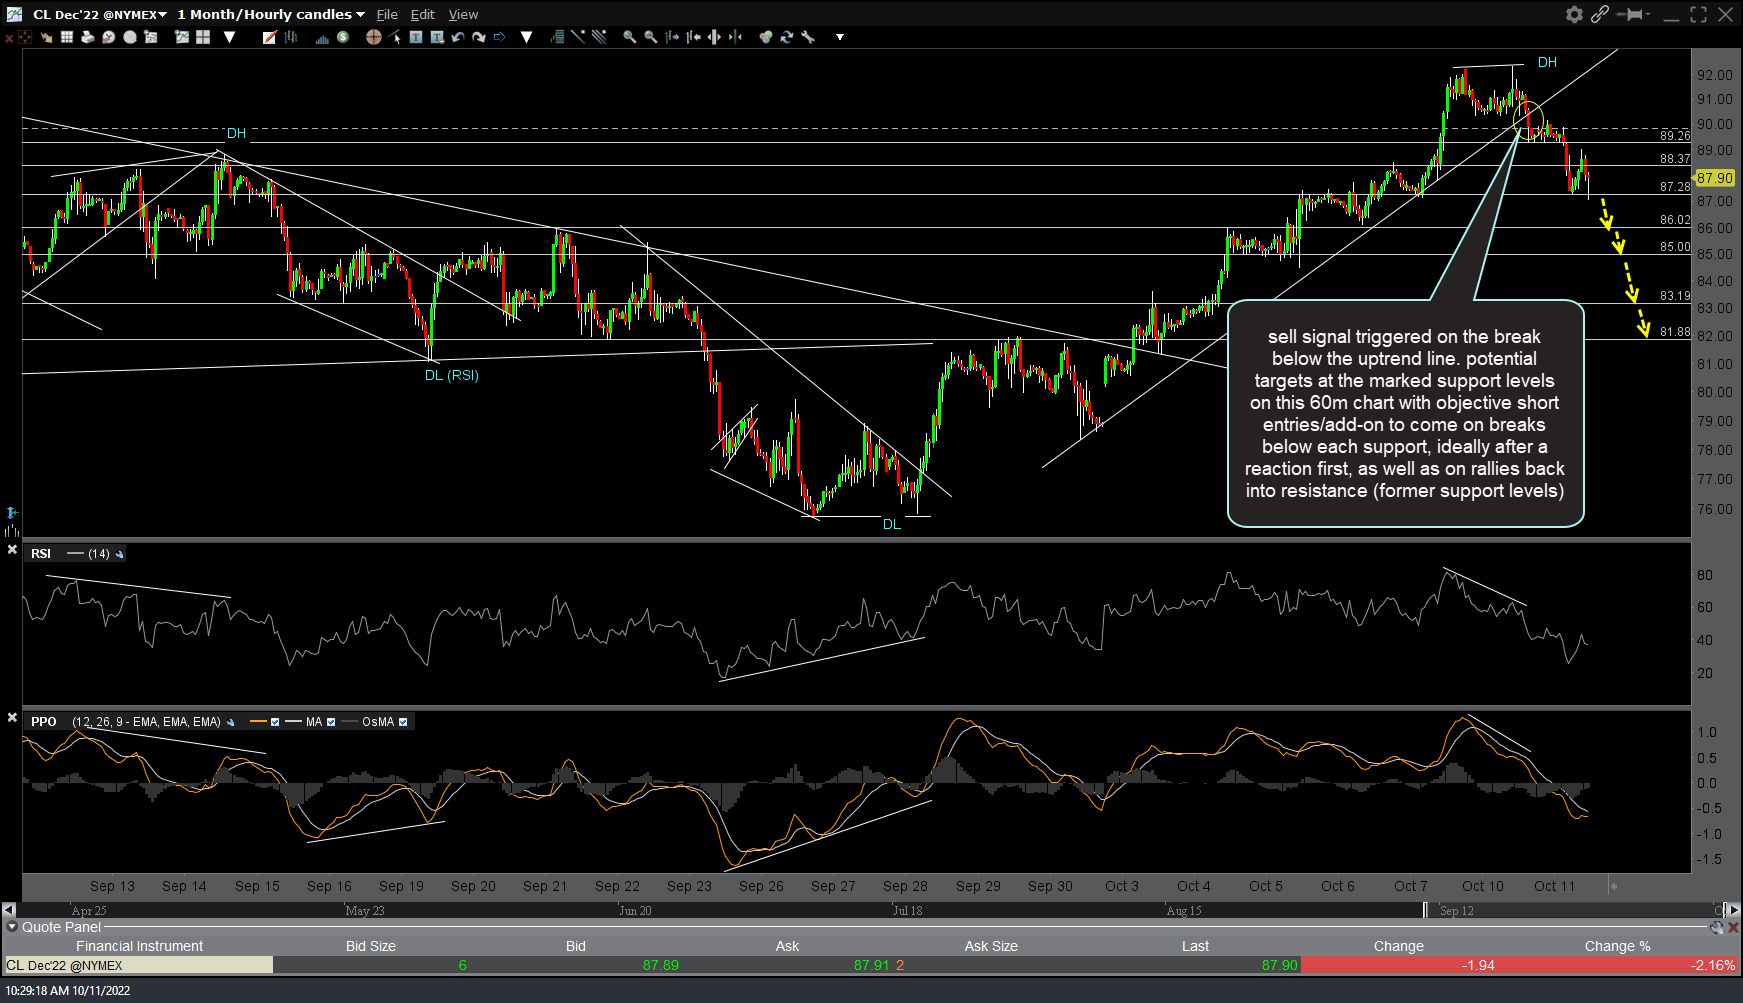
CL 60m Oct 11th