
/NQ (Nasdaq 100 futures) broke below this bear flag continuation pattern although still just a hair above the Oct 2nd reaction low & positive divergences still in place on multiple time frames. More downside still likely IMO although I remain on watch for any decent signs of a bottom/reversal. 60-minute chart below.
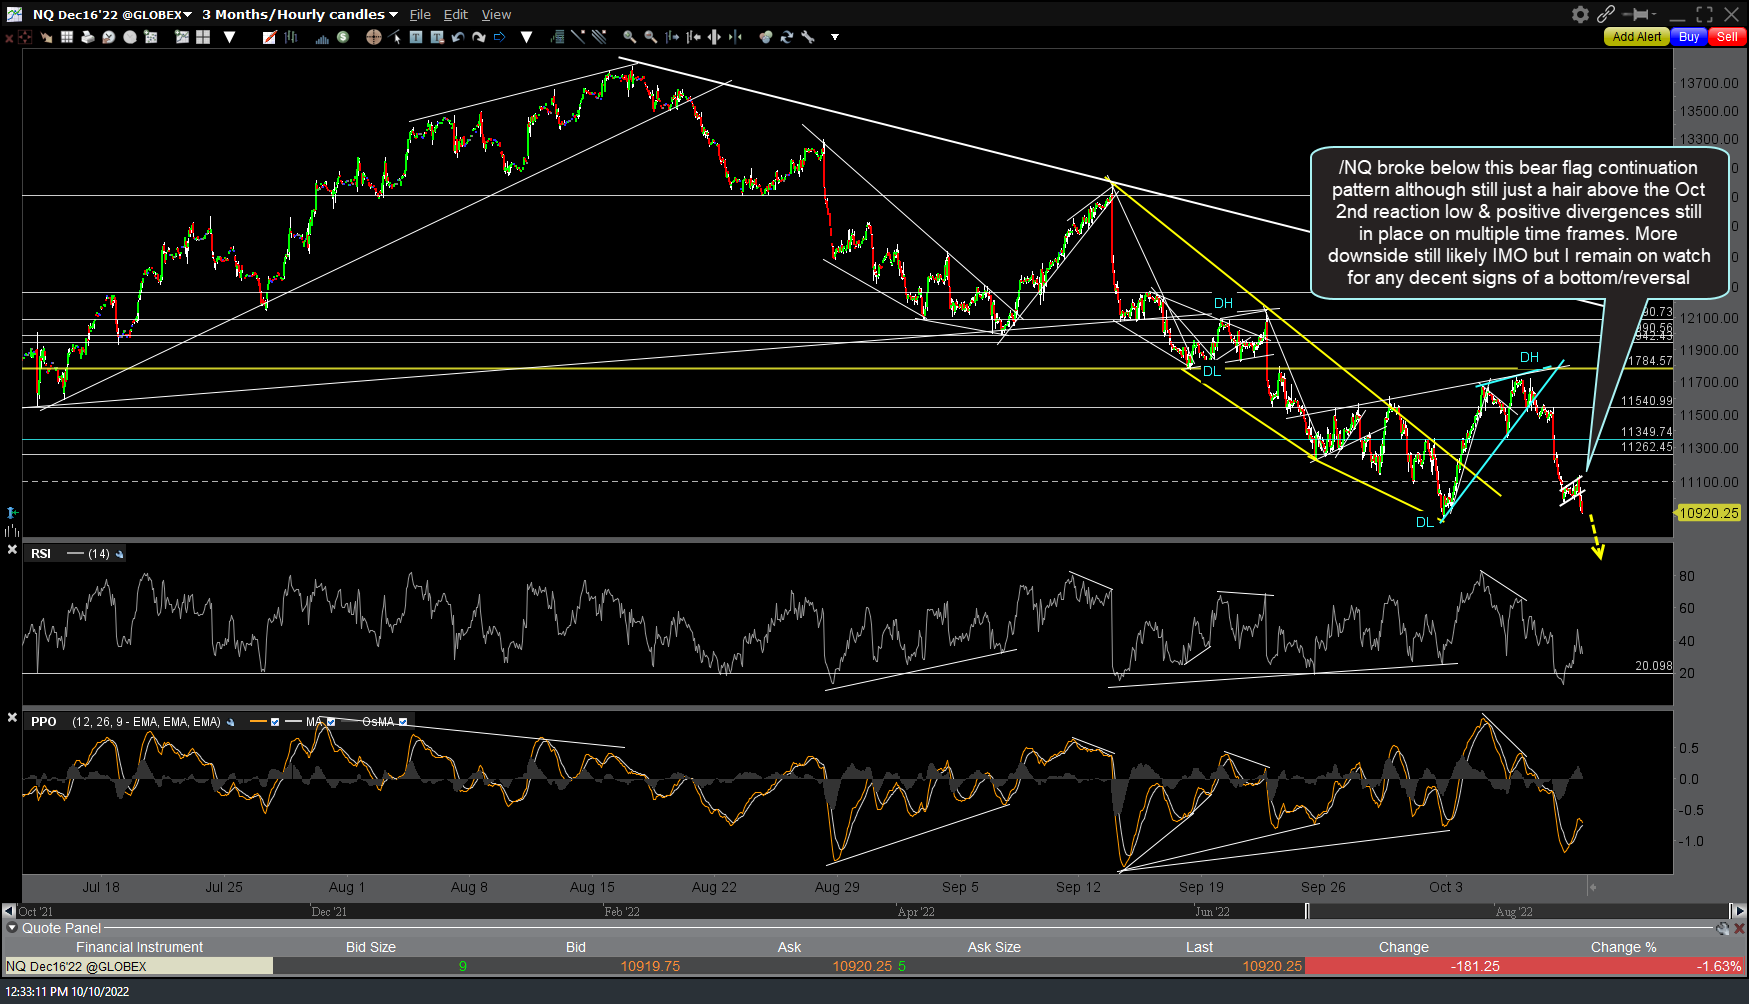
NQ 60m Oct 10th
/CL (crude oil futures) took out the downtrend line on the daily time frame which I thought we might get a reversal from but apparently not. It seems the fundamentals for crude following the recent OPEC+ (which includes Russia) plans to cut production coupled with the recent escalations in the Russia/Ukraine conflict are providing a strong tailwind for crude & other impacted commodities such as wheat (+7% today). The next big resistance now comes around 94.83ish with key uptrend line support just below. Daily chart:
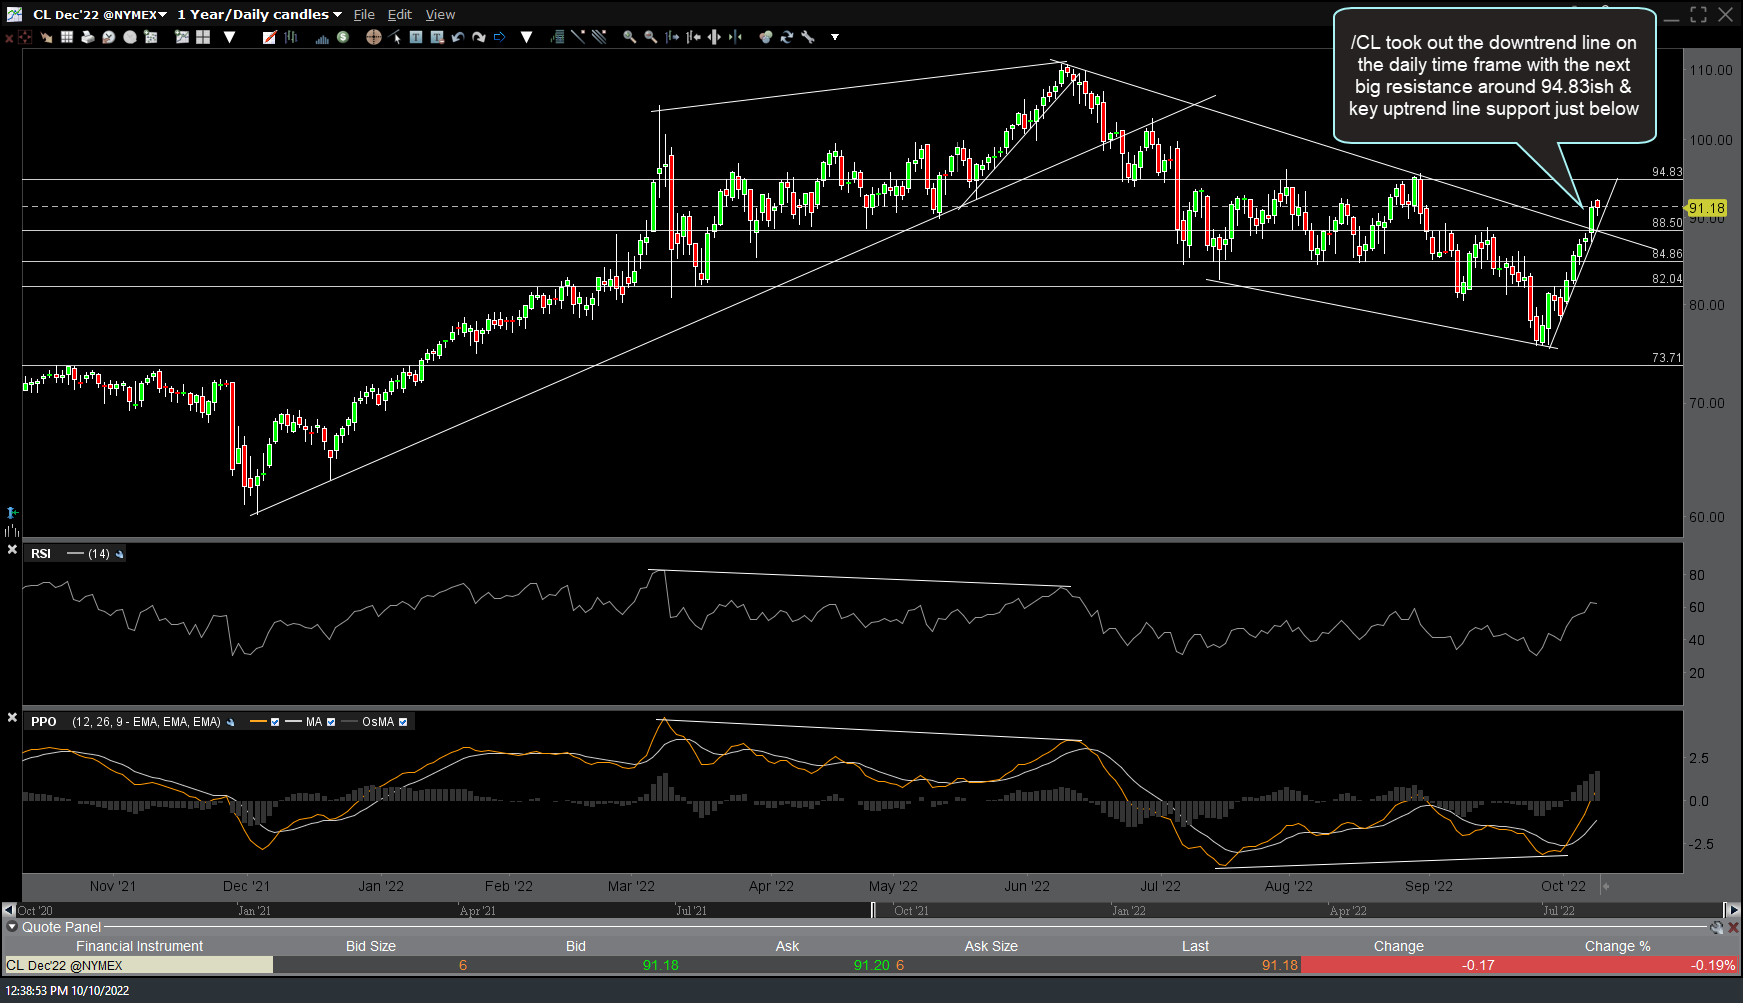
CL daily Oct 10th
Zooming down to the 120-minute (2-hr candles) chart of /CL, crude is currently testing the 92.40ish minor resistance with the next decent resistance, should it take this level out, around 95.50 & an uptrend line not far below in which a sell signal would be triggered, if/when taken out.
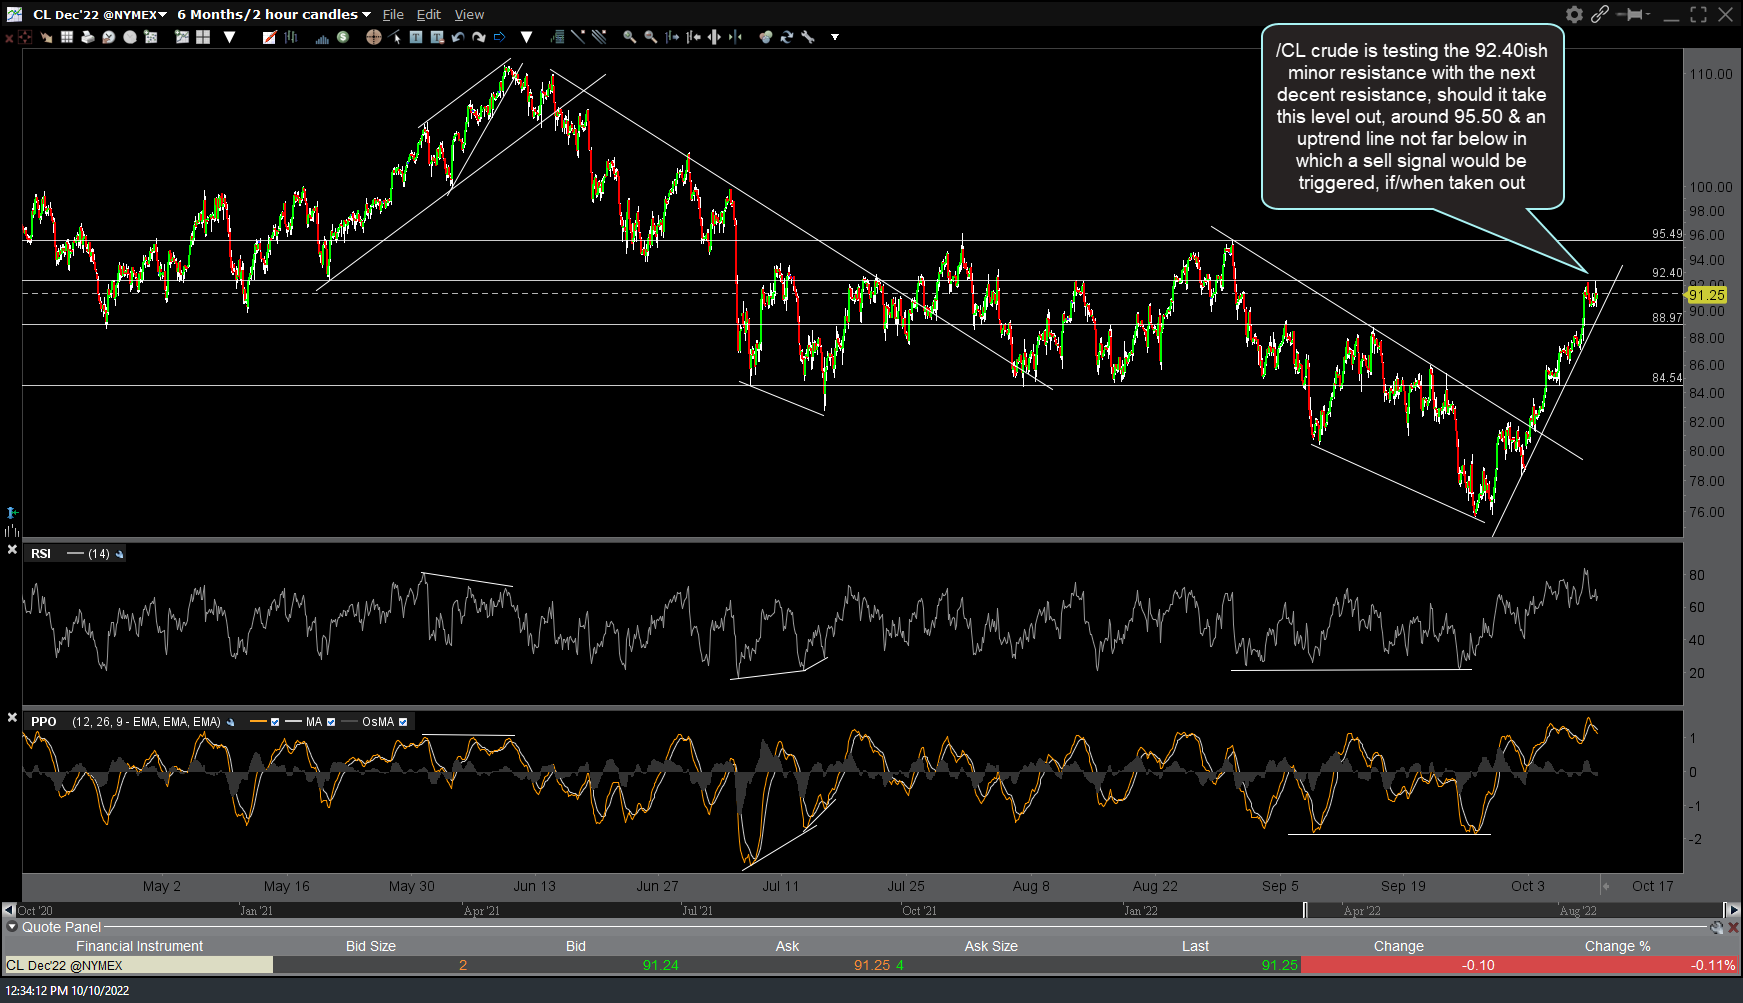
CL 120m Oct 10th
Although my home/office internet is still out & I’m still tethering off an extremely slow cellular connection due to the cell towers damaged in the storm, I decided to take a shot at recording & uploading a video as it’s much easier to do a comprehensive analysis covering multiple charts. The video covers the major stock indices, various volatility indices including the $VIX, and US Treasury bonds. The first upload attempt via the screen recording software failed but I’m making a second attempt with a direct upload via YouTube that is currently showing less than 30-minutes to completion. Should that upload complete, I will get the video posted asap.