
/ES went on to make a full tag of my 2763.50 support level & key Feb 21st reaction low in the overnight session with a minor reaction so far in the pre-market session. Buying opp for bulls, next sell signal on an impulsive break below today’s early low for the bears.
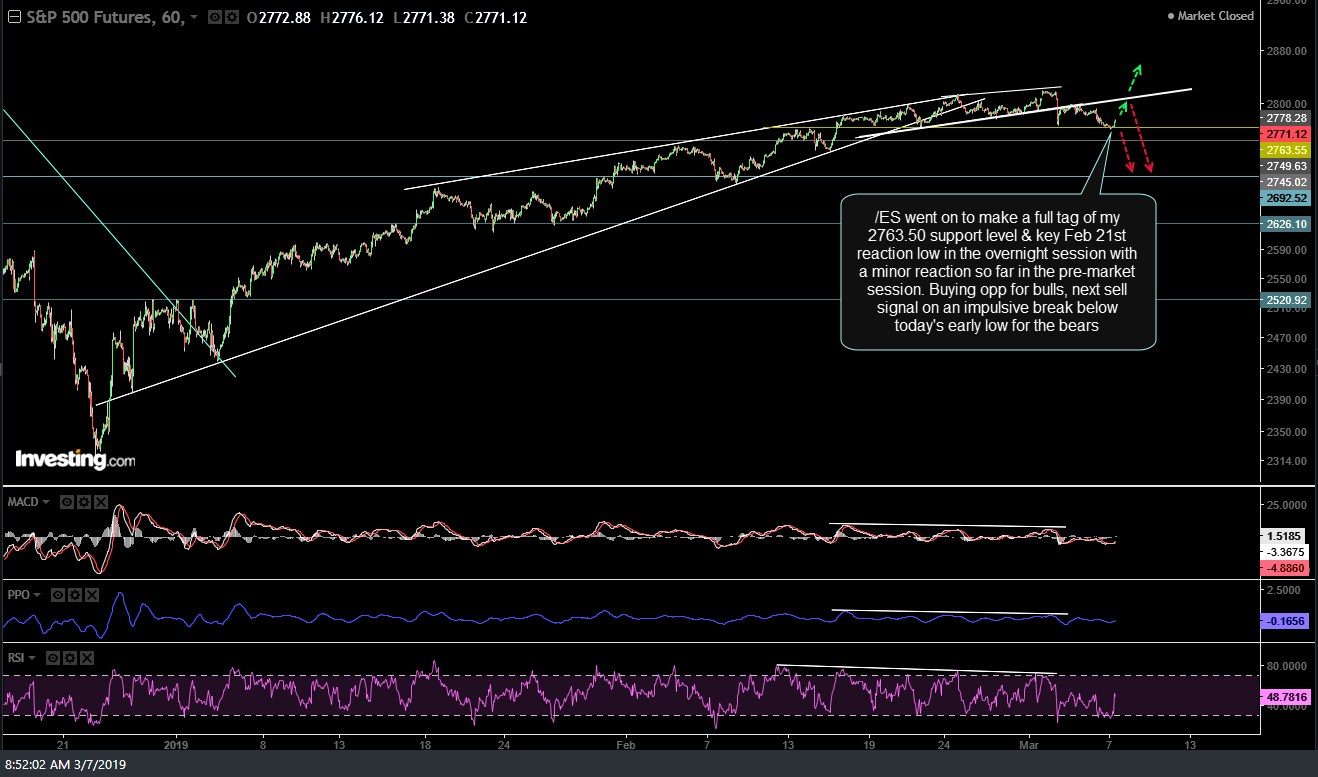
ES 60-min March 7th
/NQ backtesting this minor trendline from below. Still awaiting a break below the Fen 21st low to open the door to a deeper correction.

NQ 60-min March 7th
/RTY small cap futures making a minor rally off the 1532ish support level the hit yesterday. This is an objective entry for those bullish with a buy-the-dips strategy & also another objective short setup for an entry or add-on to an existing short position for those bearish with the next sell signal to come on an impulsive break below that level. Basically, it’s time to either pick a team (bullish or bearish/long or short) with the first decent correction & pullback to well-defined support levels to buy the dip or ready to increase or initiate short exposure on a bounce and/or break below the early morning session lows in the index futures. Of course, option C is to stand aside if you are unsure how to be positioned at this time.
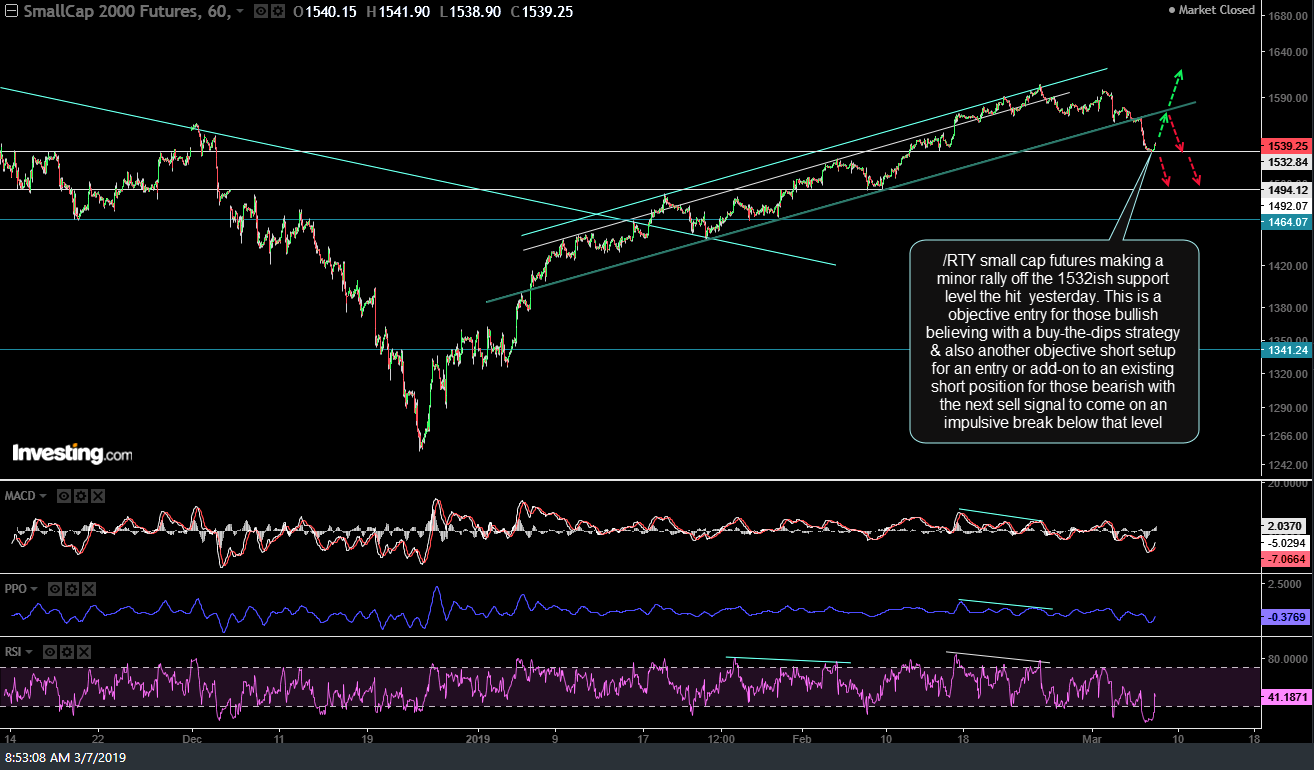
RTY 60-min March 7th
/CT cotton futures may or may not need another thrust down within this bullish falling wedge pattern but remain on watch for an impulsive breakout above the pattern + 75.30 resistance level for a buy signal on cotton and BAL.
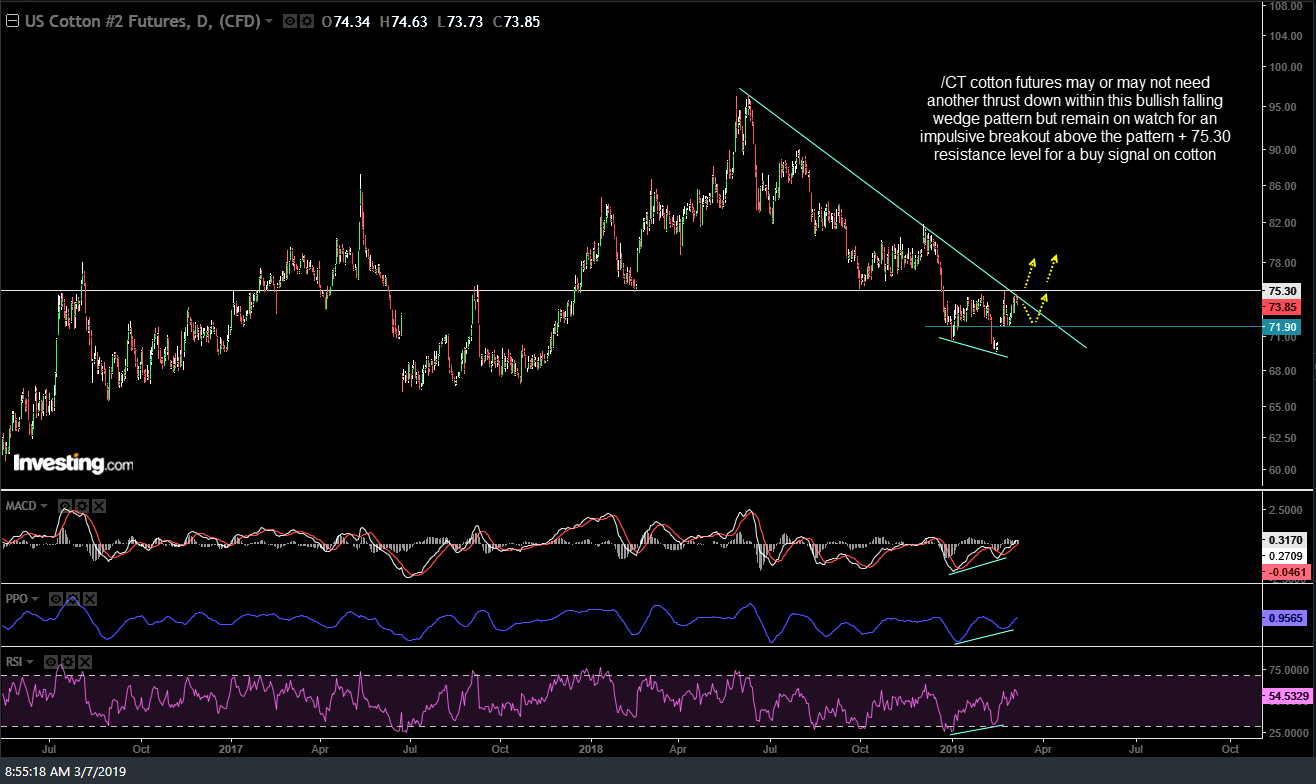
CT daily March 7th
Next buy signals on /KC coffee futures and JO to come on a break above the March 1st high & key 1.00 level & then the 101.75ish resistance level.

KC 60-min March 7th
/CL crude futures backtesting the primary uptrend line from below following the recent breakdown, divergent high & failure at longer-term resistance, thereby offering the next objective short entry on /CL, USO, DWT, etc..
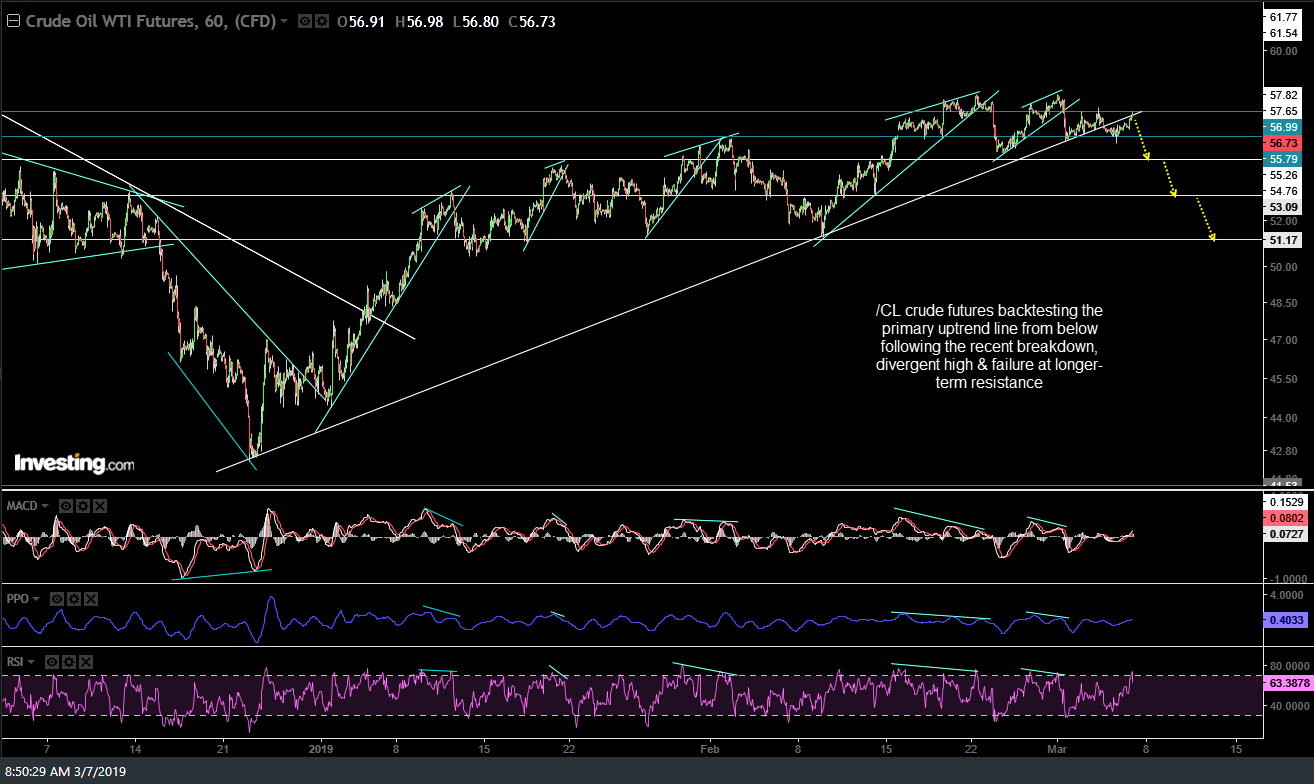
CL 60-min March 7th
TNDM was one of my favorite longs in late 2017 & early 2018 with multiple trade setups posted. Fast-forward just over 3,000% and 1-year later & it appears that the technicals have now come full circle, with TNDM on watch for a potential swing short trade with a possible Island Cluster top and/or large rising wedge breakdown. Many of those horizontal lines are old & may or may not be significant at this time as I hadn’t had a chance to clean up that chart yet although I did add/list the next 3 potential pullback targets.
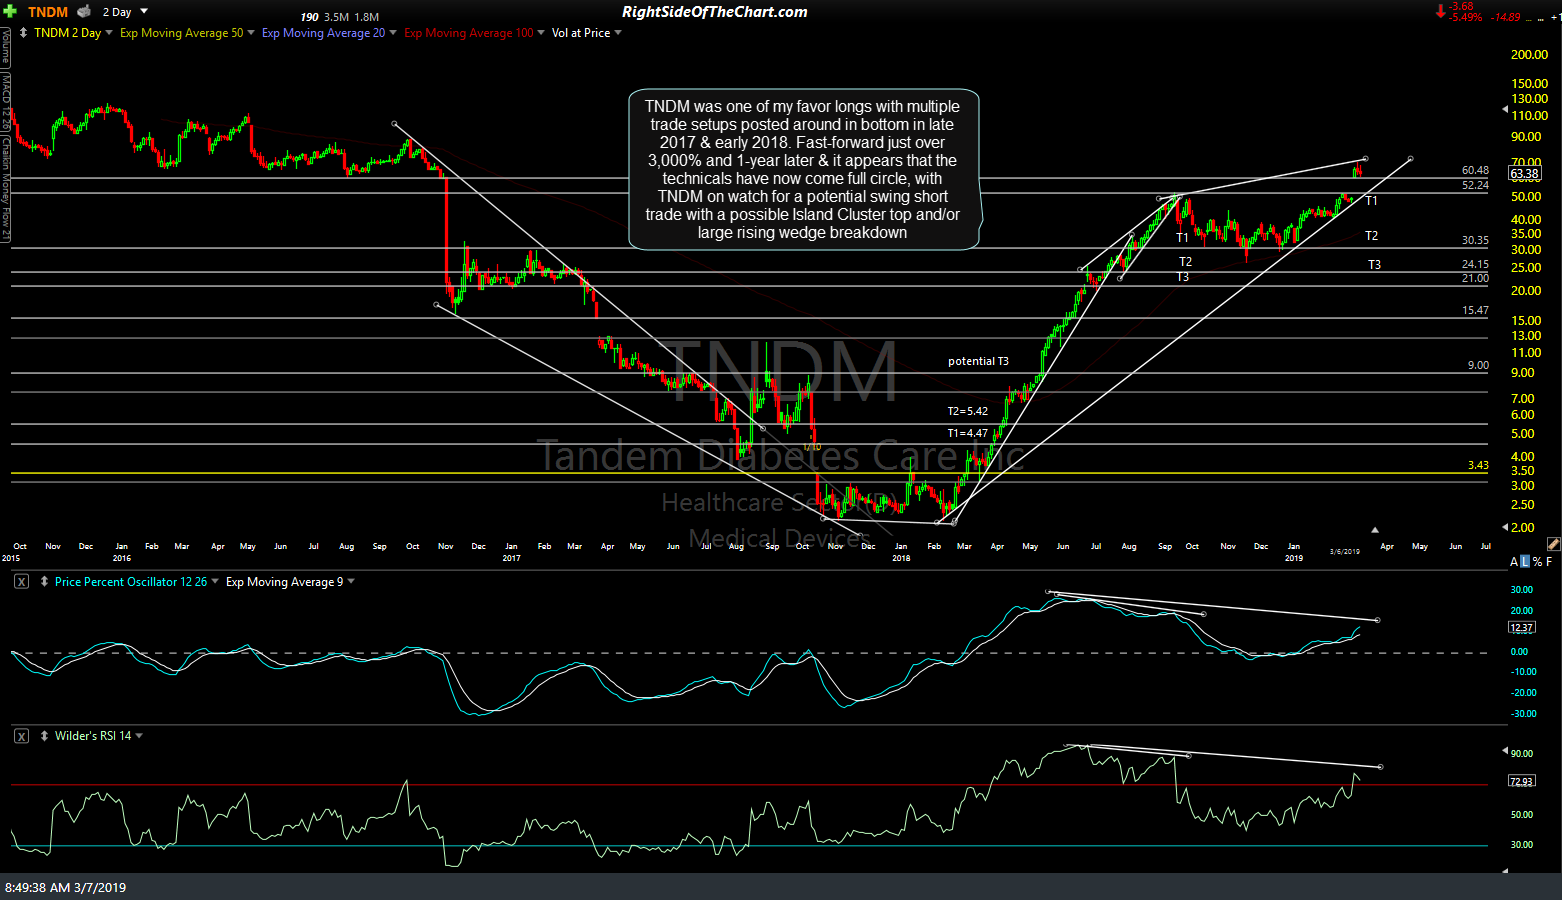
TNDM bi-daily March 7th