
While not an all-inclusive list, here are some of the charts that I’m watching today:
Same old, same old on the broad market as the S&P 500 continues to test the key 2800ish (SPY 282ish) level for the 5th consecutive week. Unless something really big occurs intraweek, I’m mainly concerned with how the weekly candlestick closes at 4pm on Friday. SPY weekly chart below.
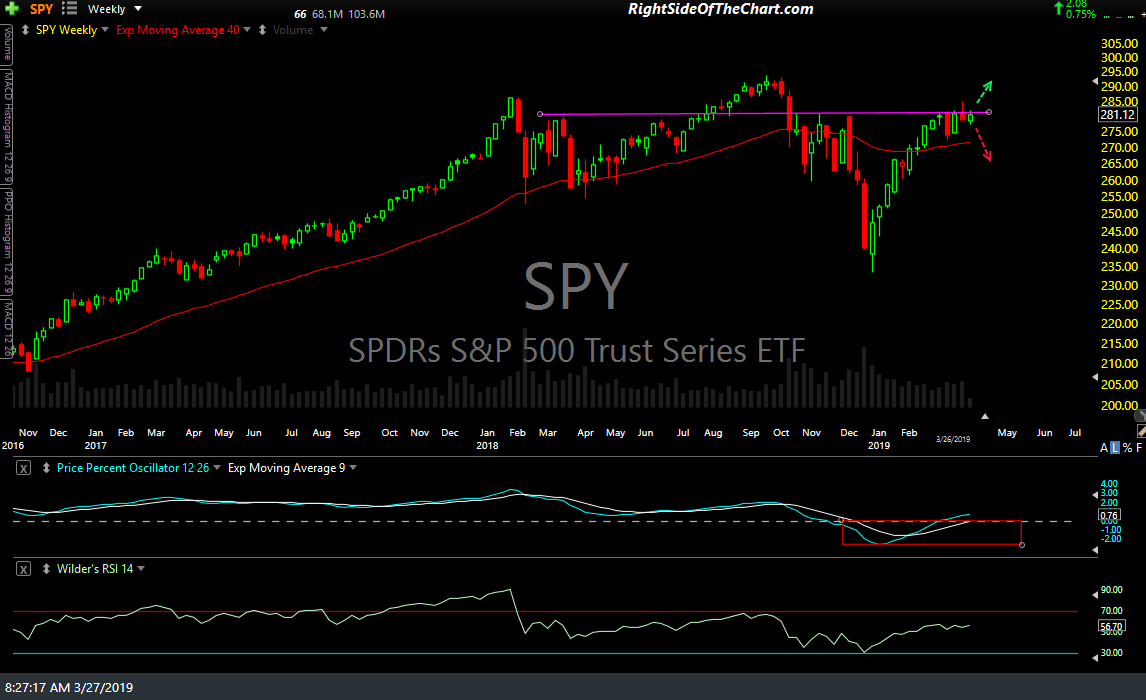
SPY weekly March 27th
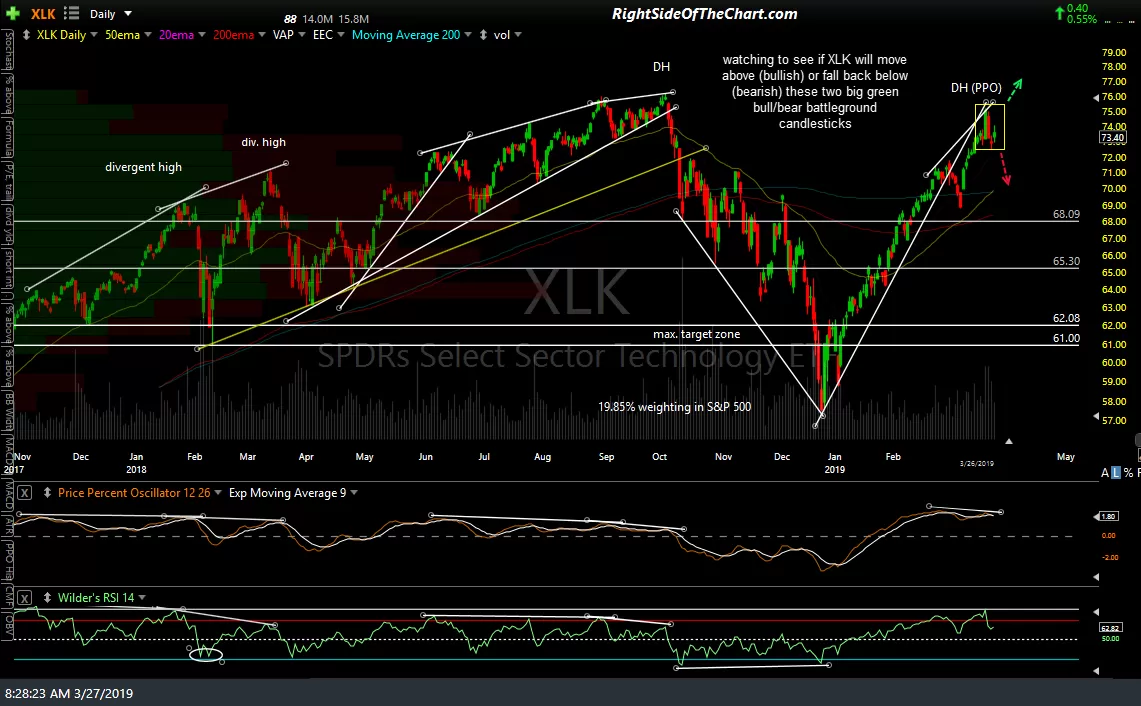
On both QQQ & the very closely related tech sector ETF, XLK, it appears that the two large candlesticks from last Friday & this Monday are technically significant: Bullish if taken out to the upside & bearish if QQQ & XLK drop back below them as well as yesterday’s lows.
-
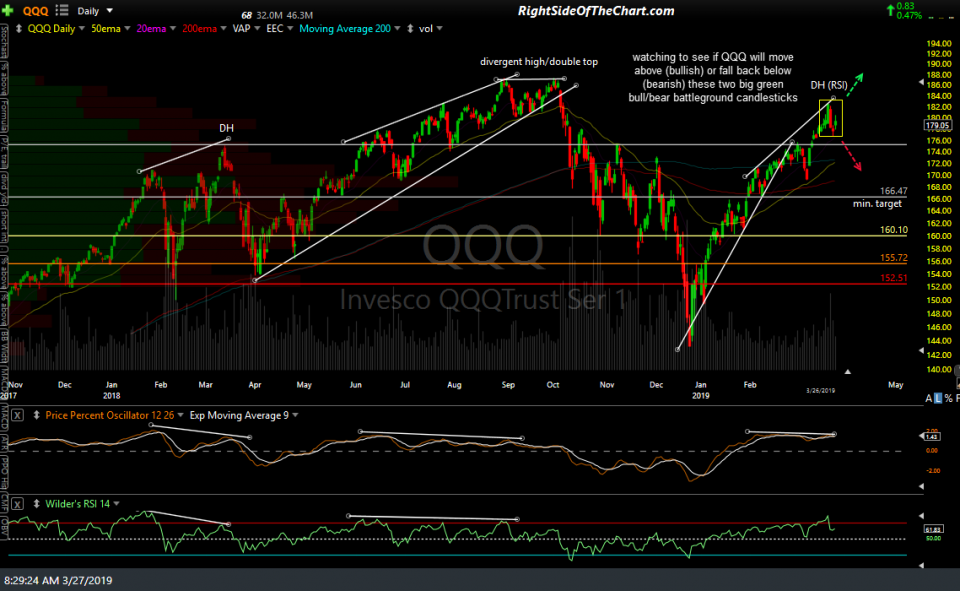
- QQQ daily March 27th

-
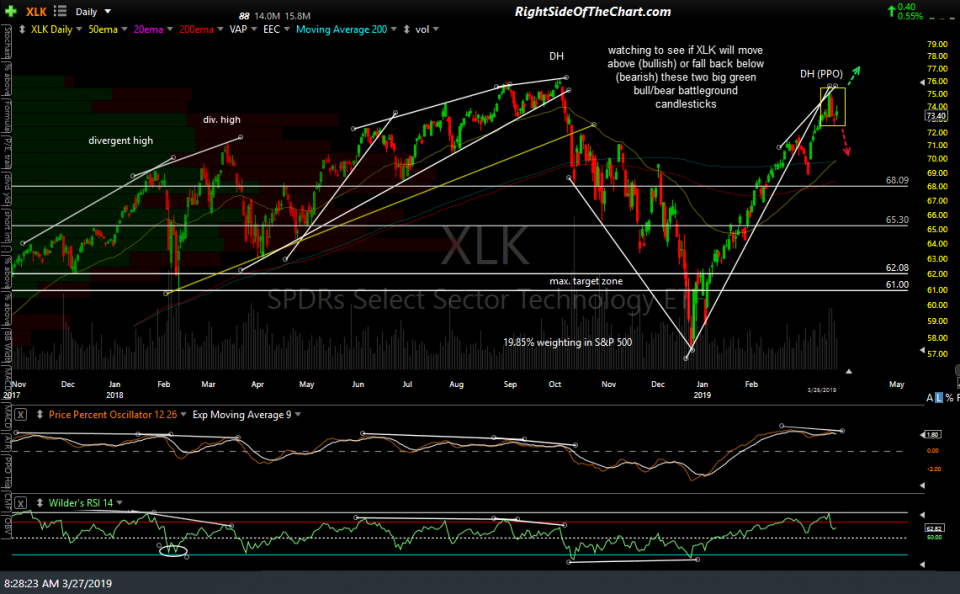
- XLK daily March 27th
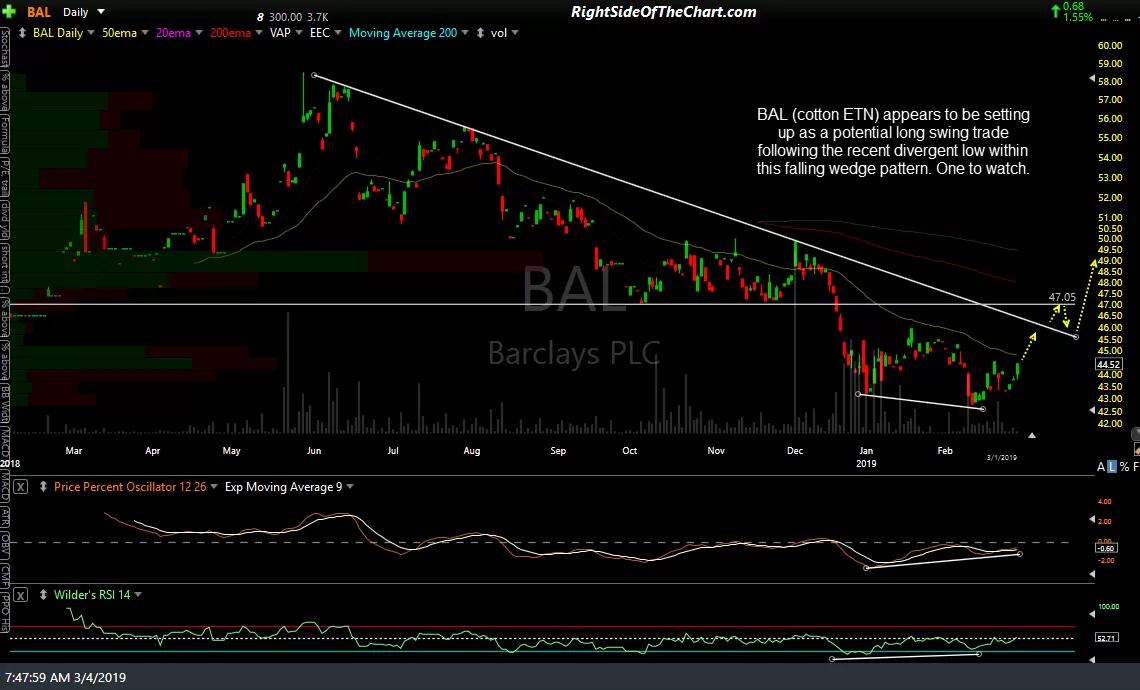
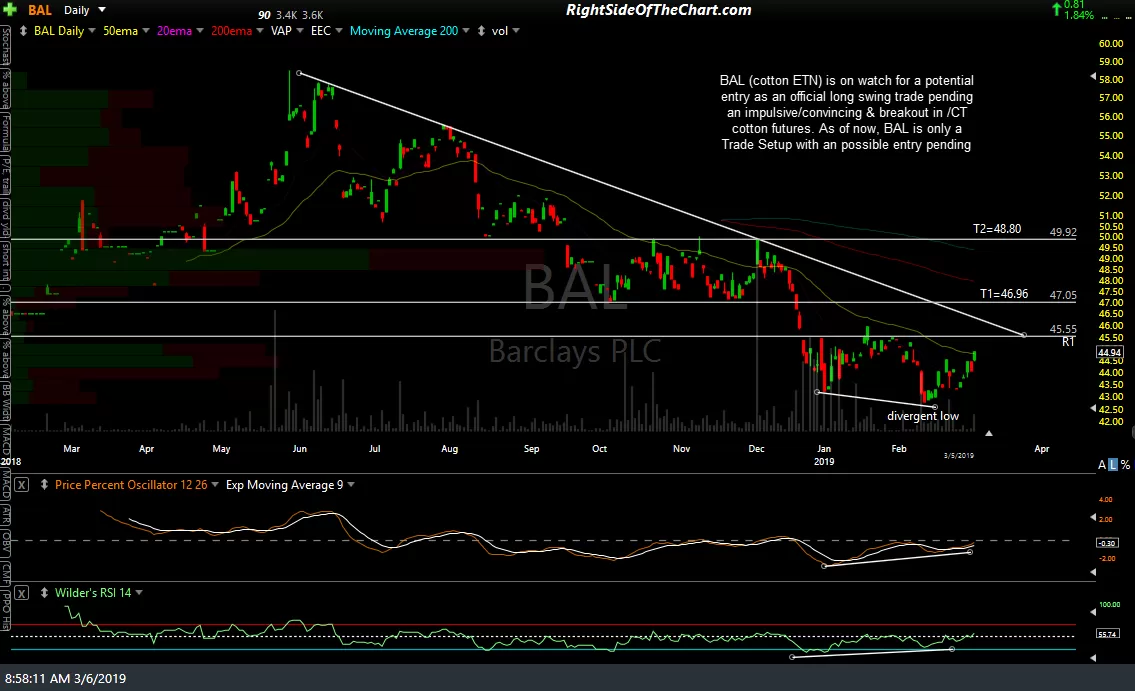
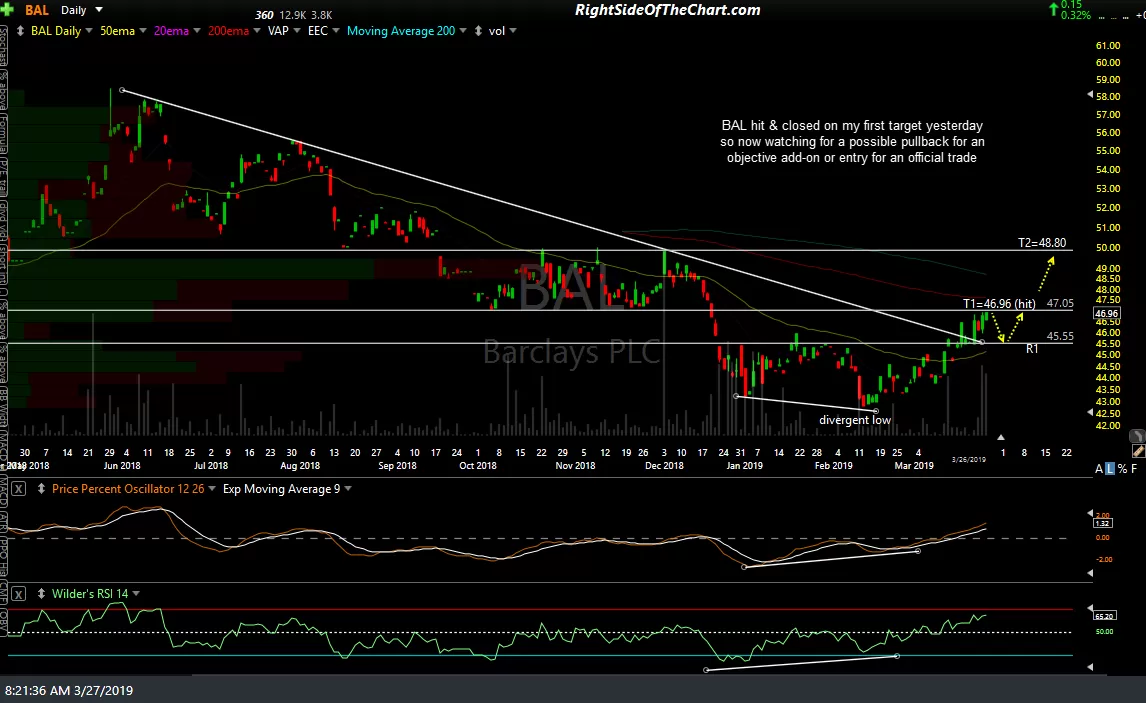
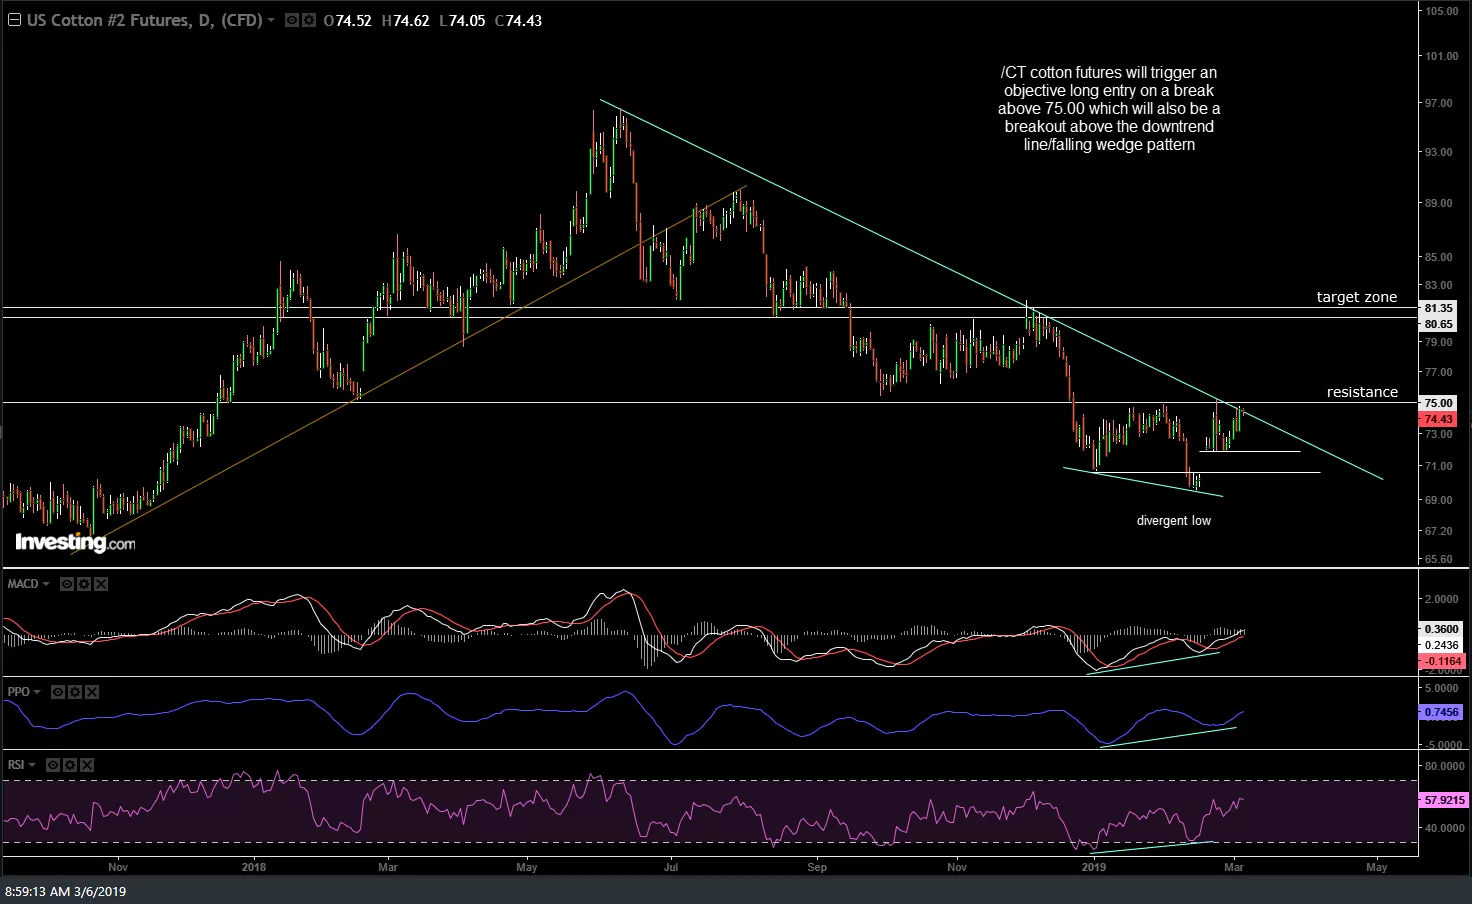
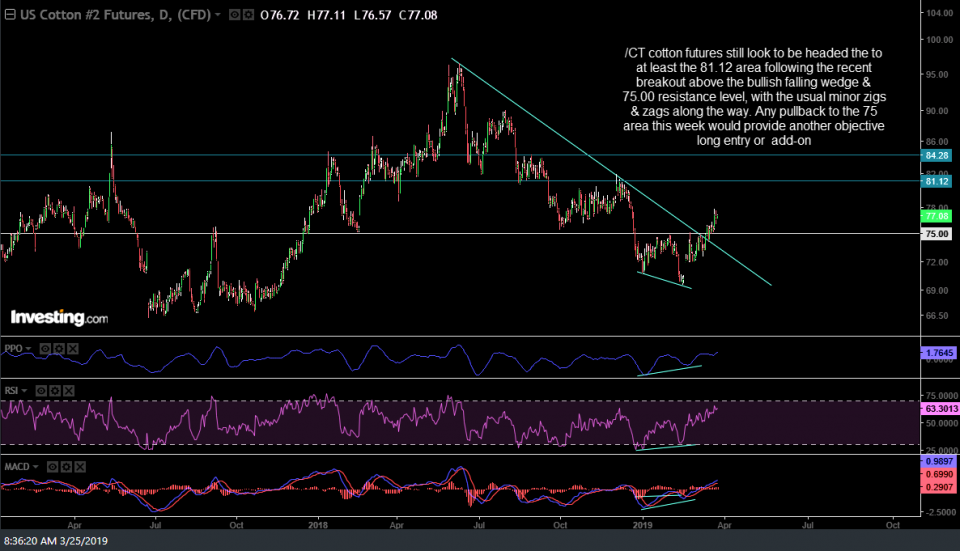
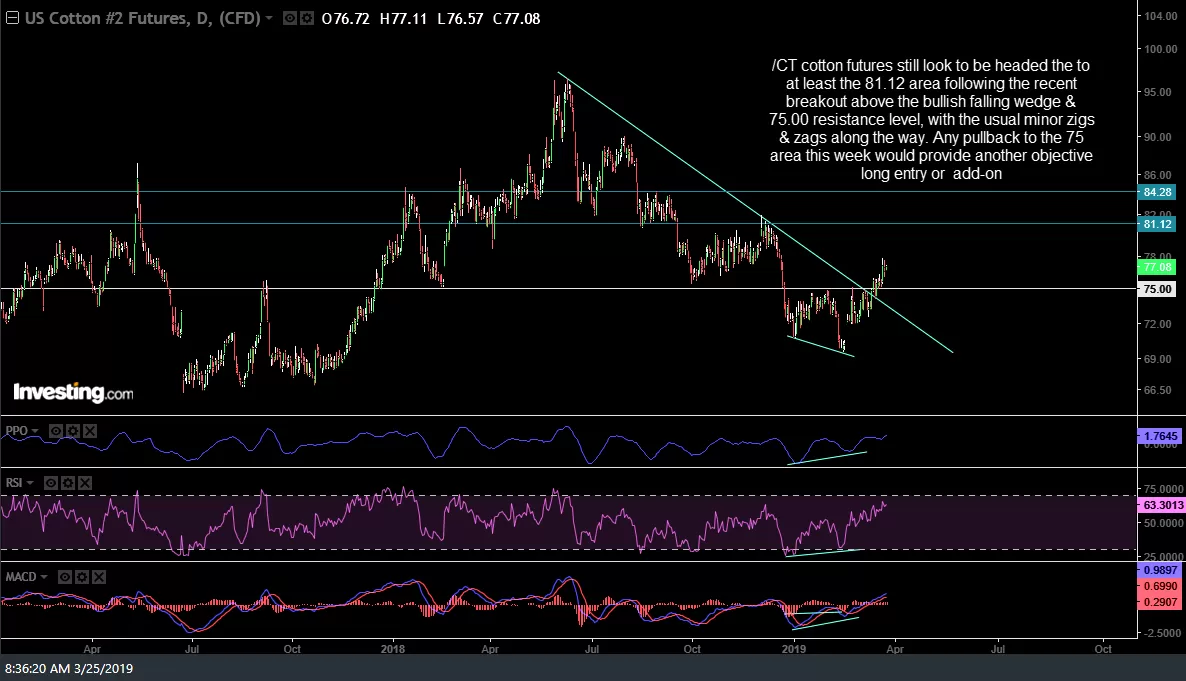
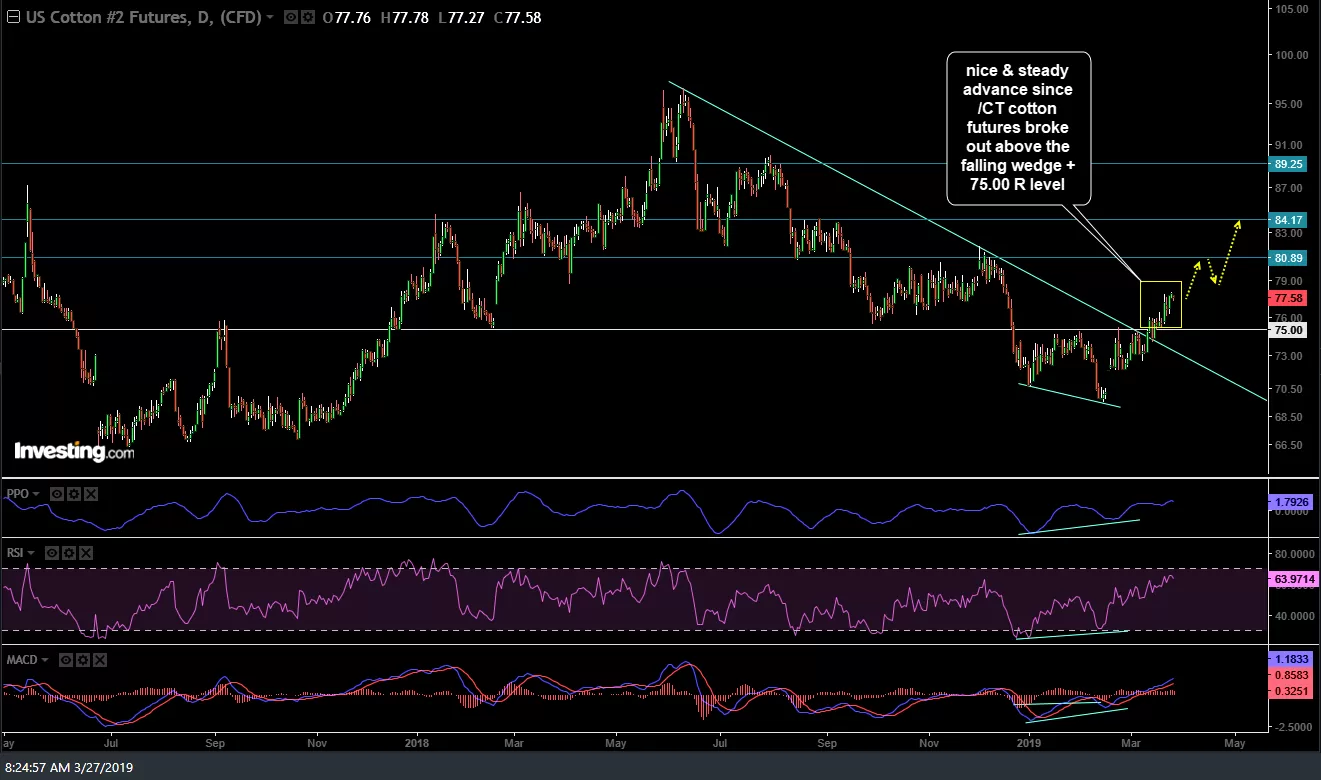
BAL (cotton ETN) hit & closed on my first target yesterday so now watching for a possible pullback for an objective add-on or entry for an official trade. BAL is still an unofficial trade as well as a trade setup for an official trade, pending the next objective entry. Previous & updated charts on BAL & /CT (cotton futures) below:
-
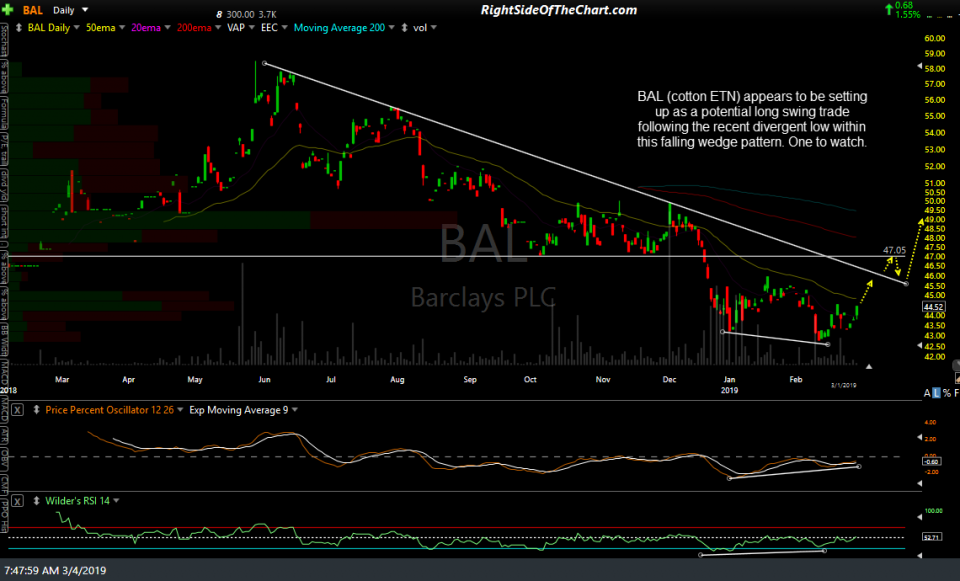
- BAL daily March 4th
-

- BAL daily March 5th close
-
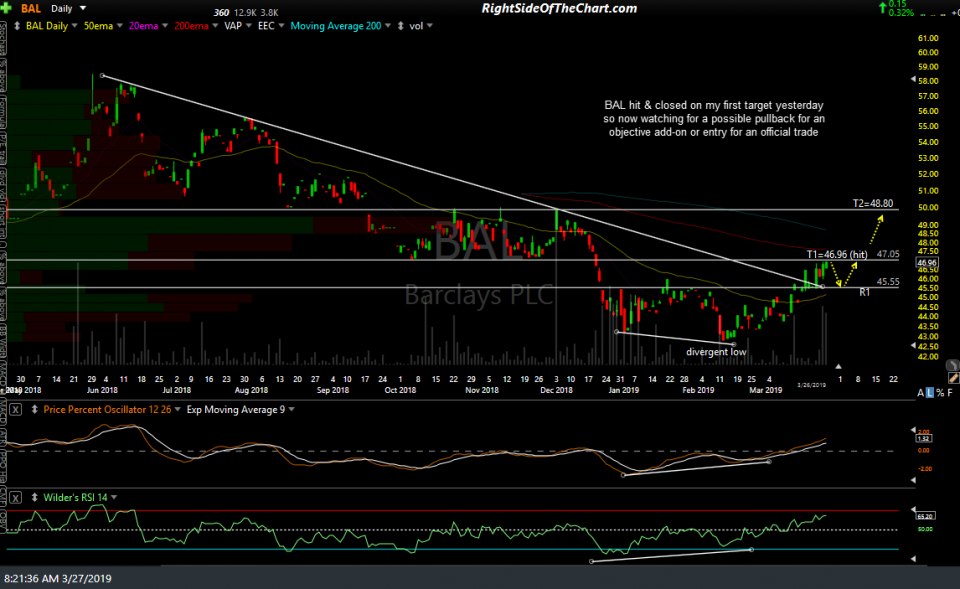
- BAL daily March 27th
-
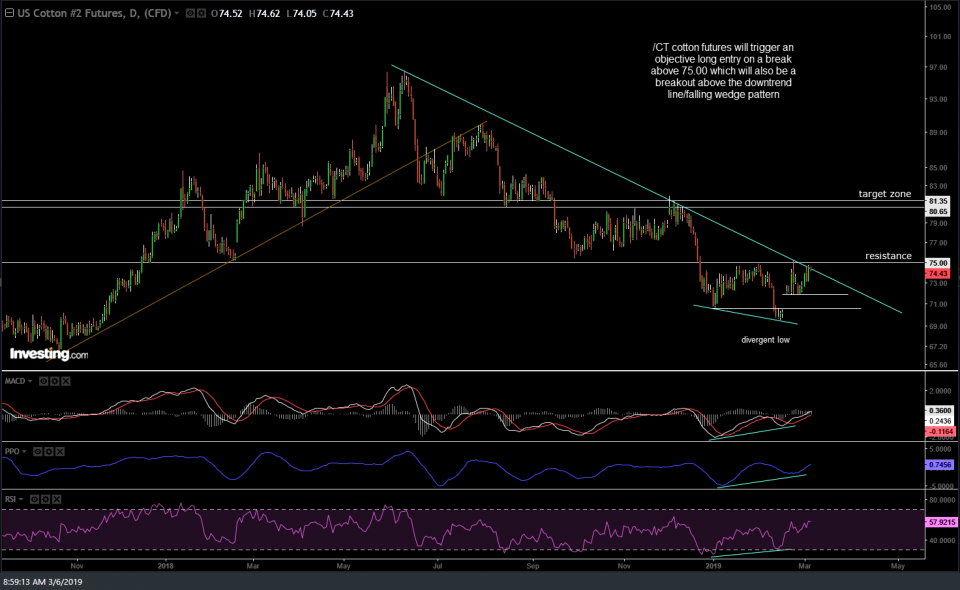
- CT daily March 6th
-
- CT daily March 25th
-
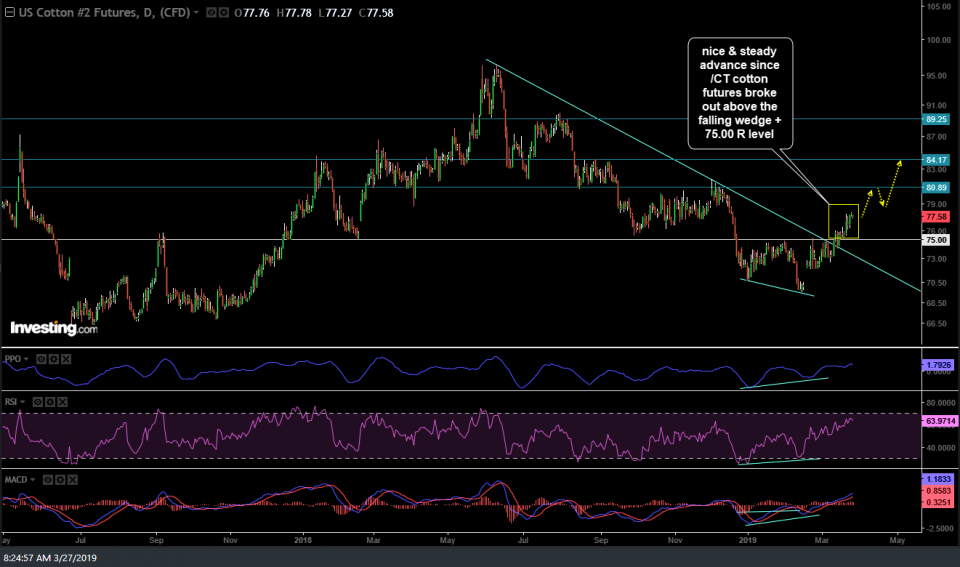
- CT daily March 27th
USO (crude oil ETN) has been wedging higher with a fairly tight correlation to the stock market since last fall. As such, whether crude breaks down below this rising wedge & falls to any or all of the targets shown below will likely depend on whether the broad market fails or succeeds in taking out the key 2800ish resistance level. Also, keep in mind that the correlation between crude oil & the stock market can be an on & off correlation, so it is entirely possible that crude breaks down below this wedge & corrects while the stock market continues to trade sideways or starts to move higher.

USO daily March 27th