
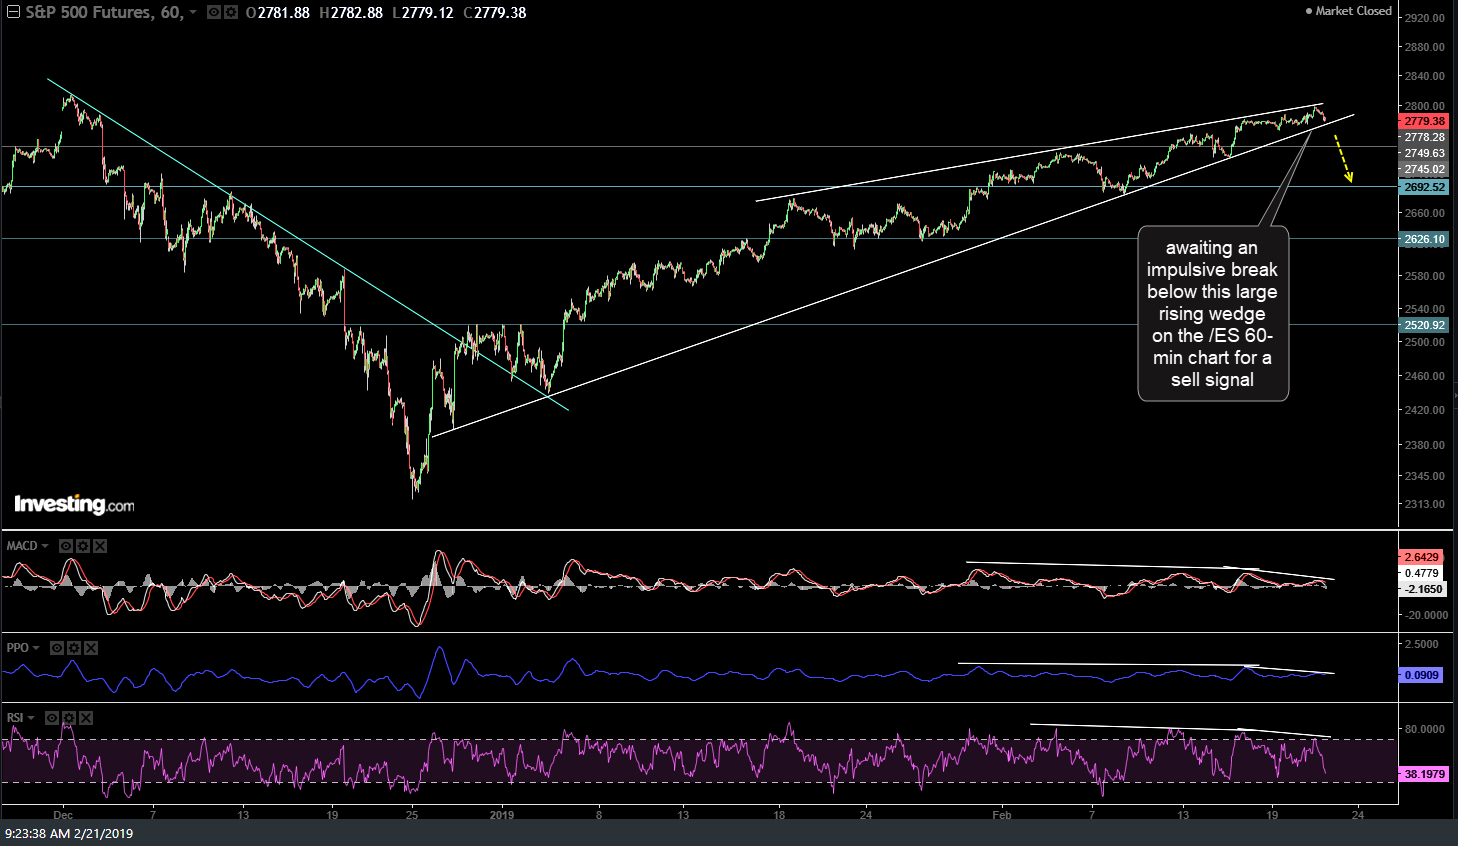
Awaiting an impulsive break below this large rising wedge on the /ES 60-min chart for a sell signal while /NQ starting to crack below the wedge, but needs a comparable break on /ES to confirm the sell signal. (charts in a ‘gallery’, such as the first two below, will not appear on the email notifications but can be viewed on the site by clicking on the title of this post).
-

- ES 60-min Feb 21st
-

- NQ 60-min Feb 21st

SOXX (semiconductor sector ETF) ran into key downtrend line resistance yesterday following an extended, overbought run.. a likely reversal point.
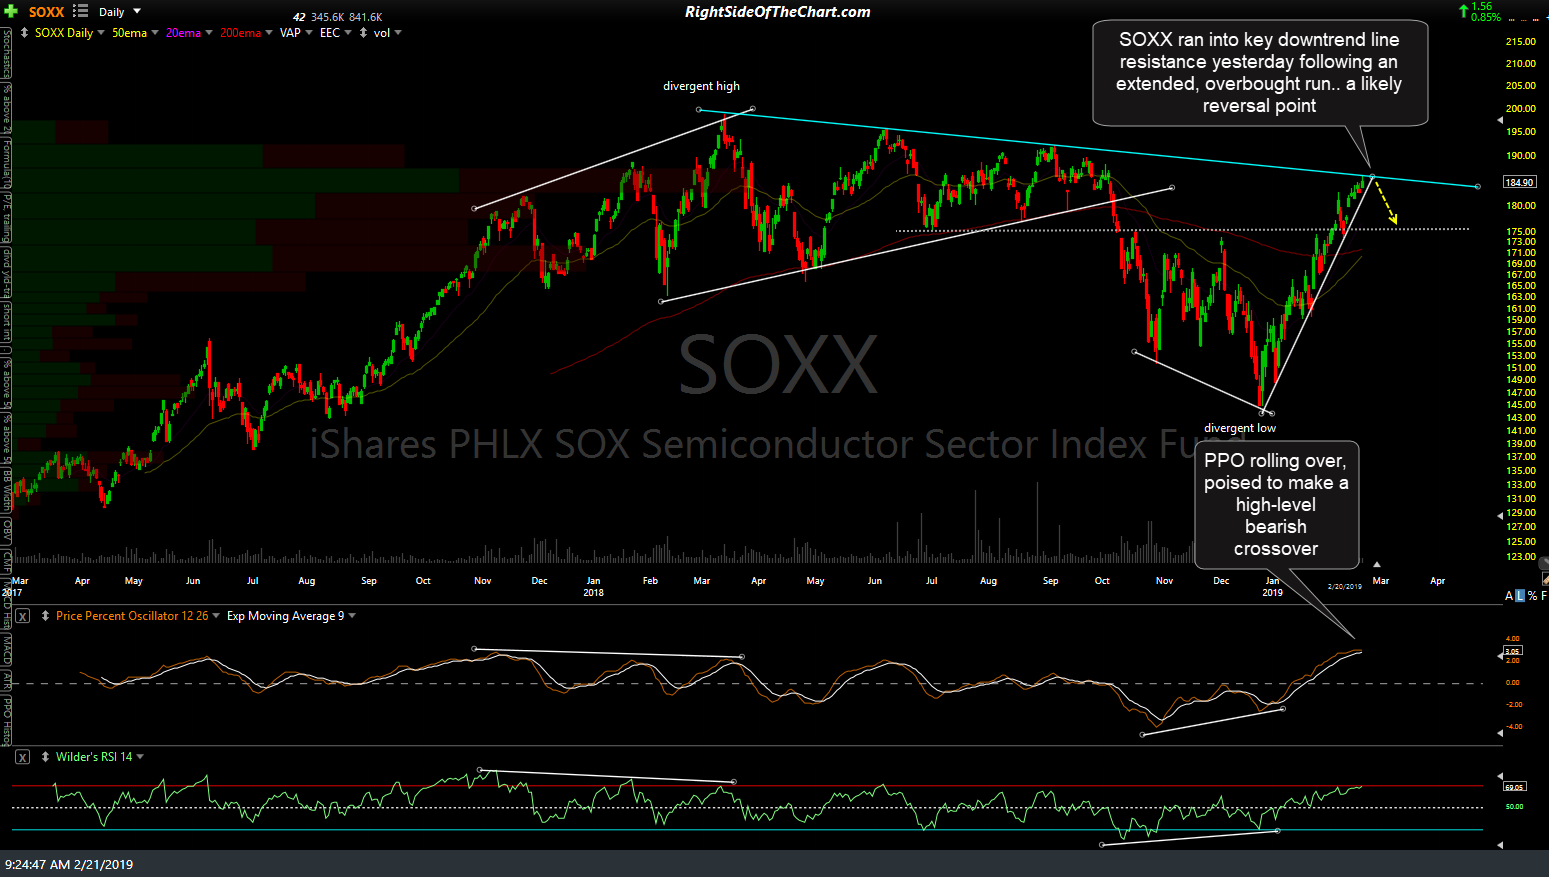
SOXX daily Feb 21st
Awaiting a break below this minor uptrend line for the next sell signal on /CL (crude oil futures) as well as any of the crude ETNs such as USO, DWT, etc.
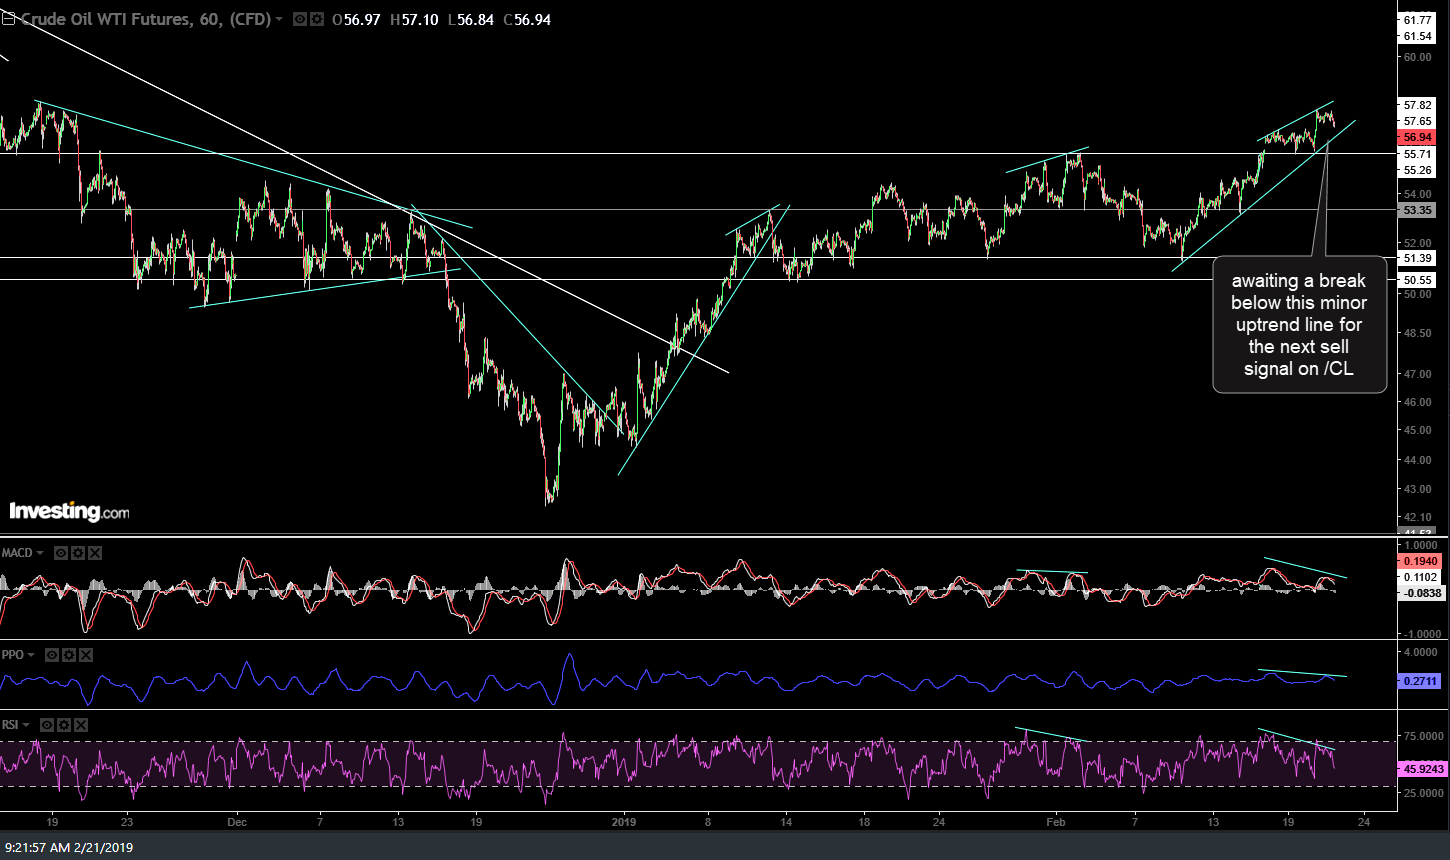
CL 60-min Feb 21st