/NQ (Nasdaq 100 futures) remains above both yellow uptrend line (which aligns with the QQQ 60-min uptrend line) as well as the 8200 support level with a near-term sell signal pending a solid break below those levels. 60-minute chart:

NQ 60m Nov 8th
The risk-off assets are in precarious technical postures as we head into the final trading session of the week (i.e.- with the weekly candlesticks finalized at 4 pm today). /GC (gold futures) starts the early trading session cracking below the 1466ish resistance level & ideally needs to snap back above to close the week above that level & keep the potential RSI divergence intact.
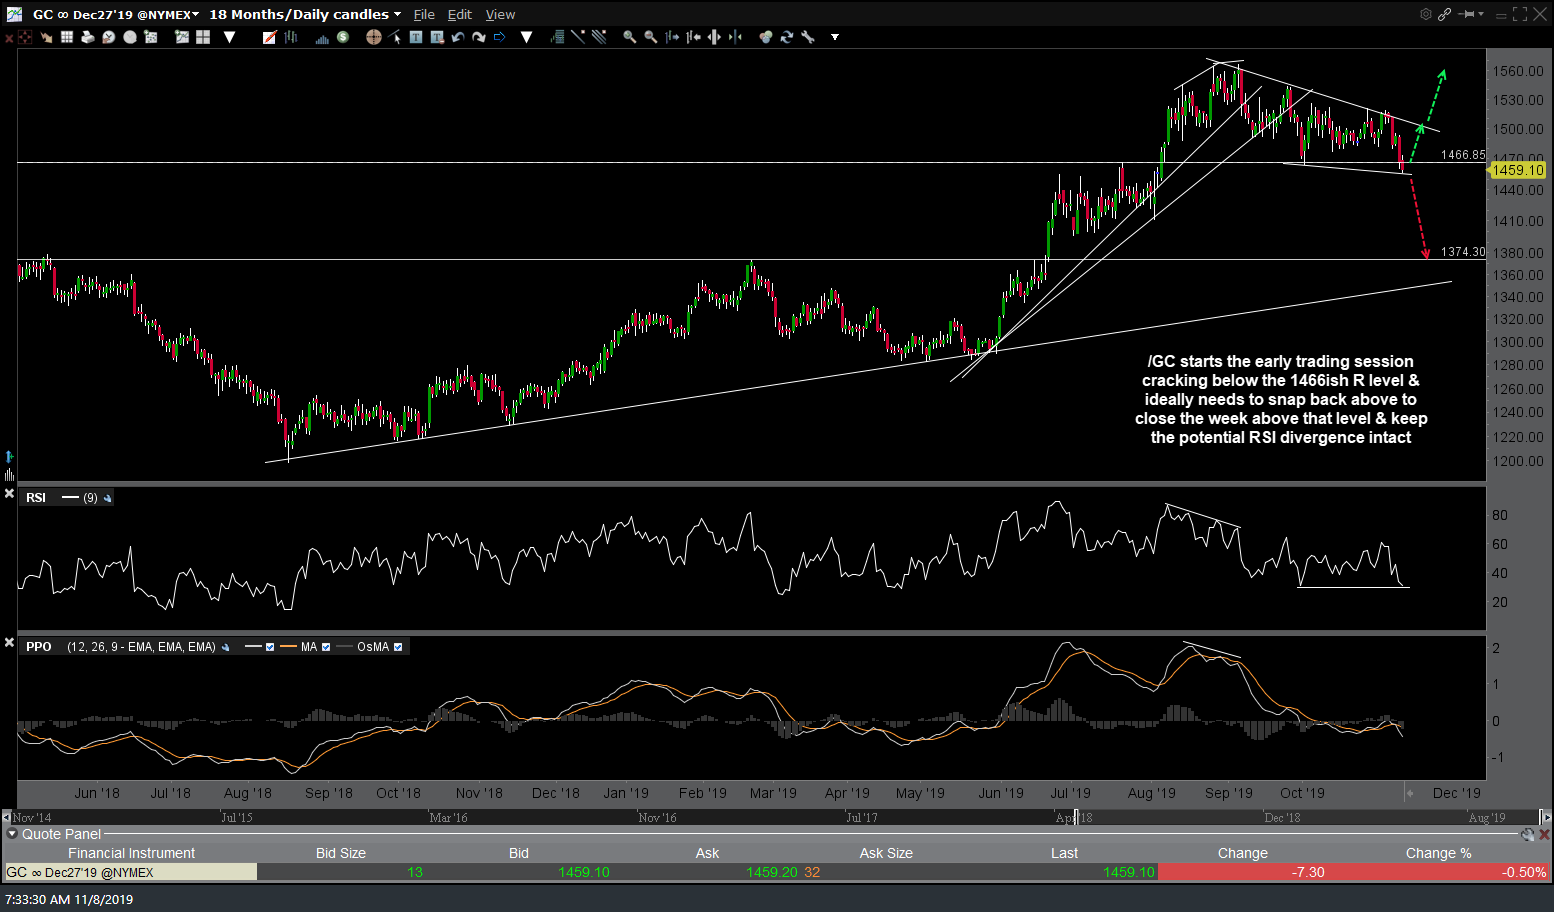
GC daily Aug 8th
GLD (gold ETF) heads into the final trading session of the week just above the key 137ish gap support/bottom of the 3-month consolidation/trading range so how it closes the week today could provide some clues as to the next near-term & possibly intermediate-term trend.
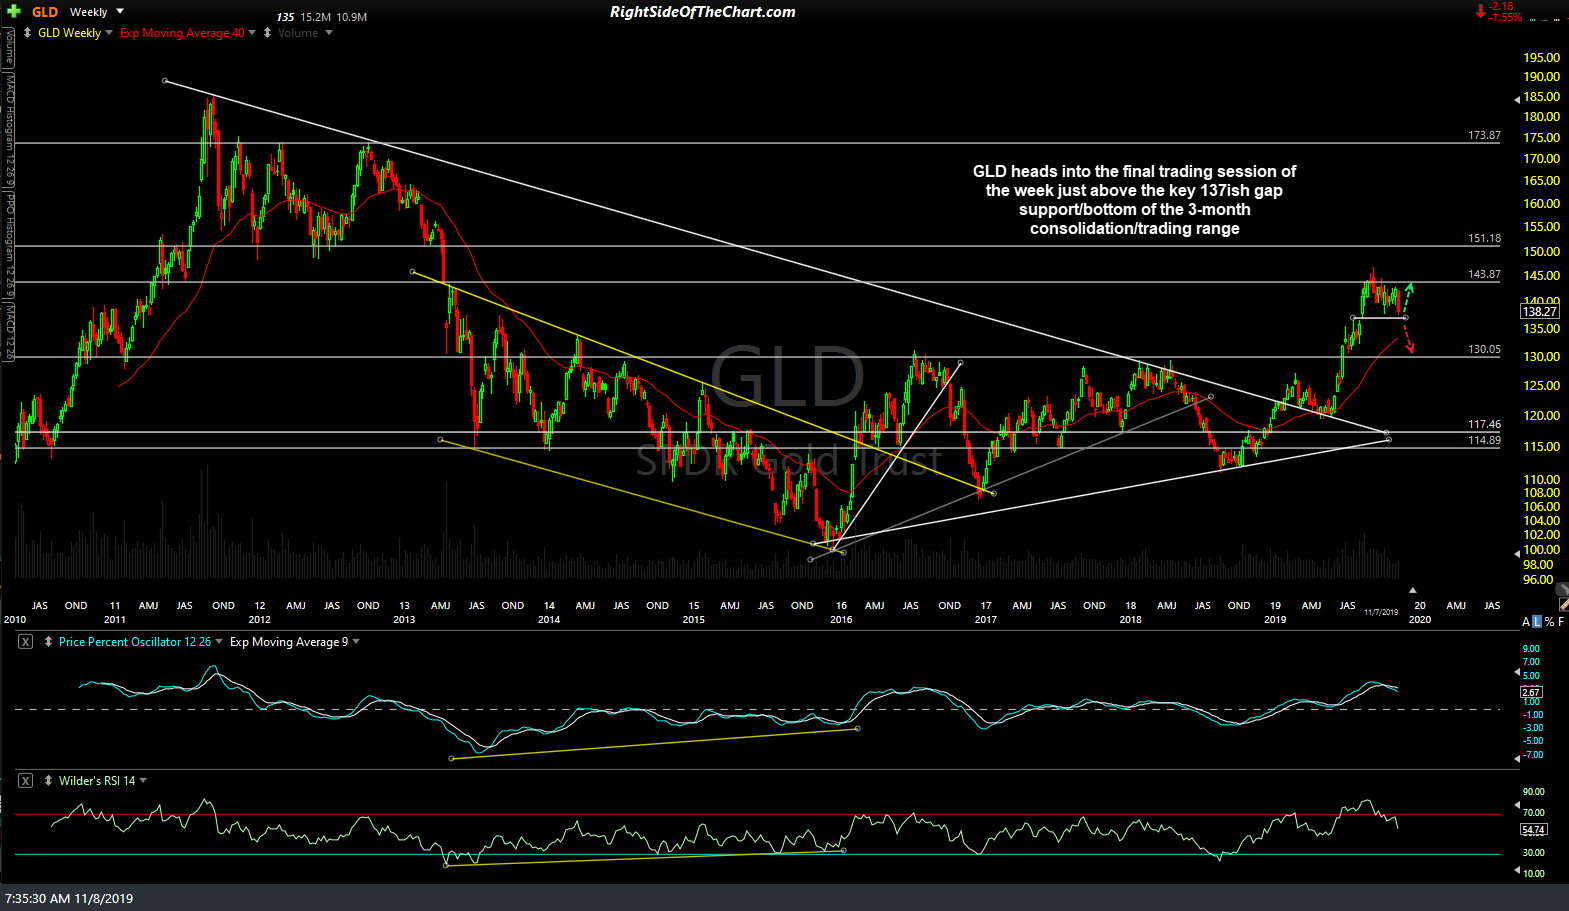
GLD weekly Nov 7th close
Make or break time for TLT as it tests intersecting uptrend line support with just today’s trading session remaining before this week’s candlestick is finalized. Weekly chart below:
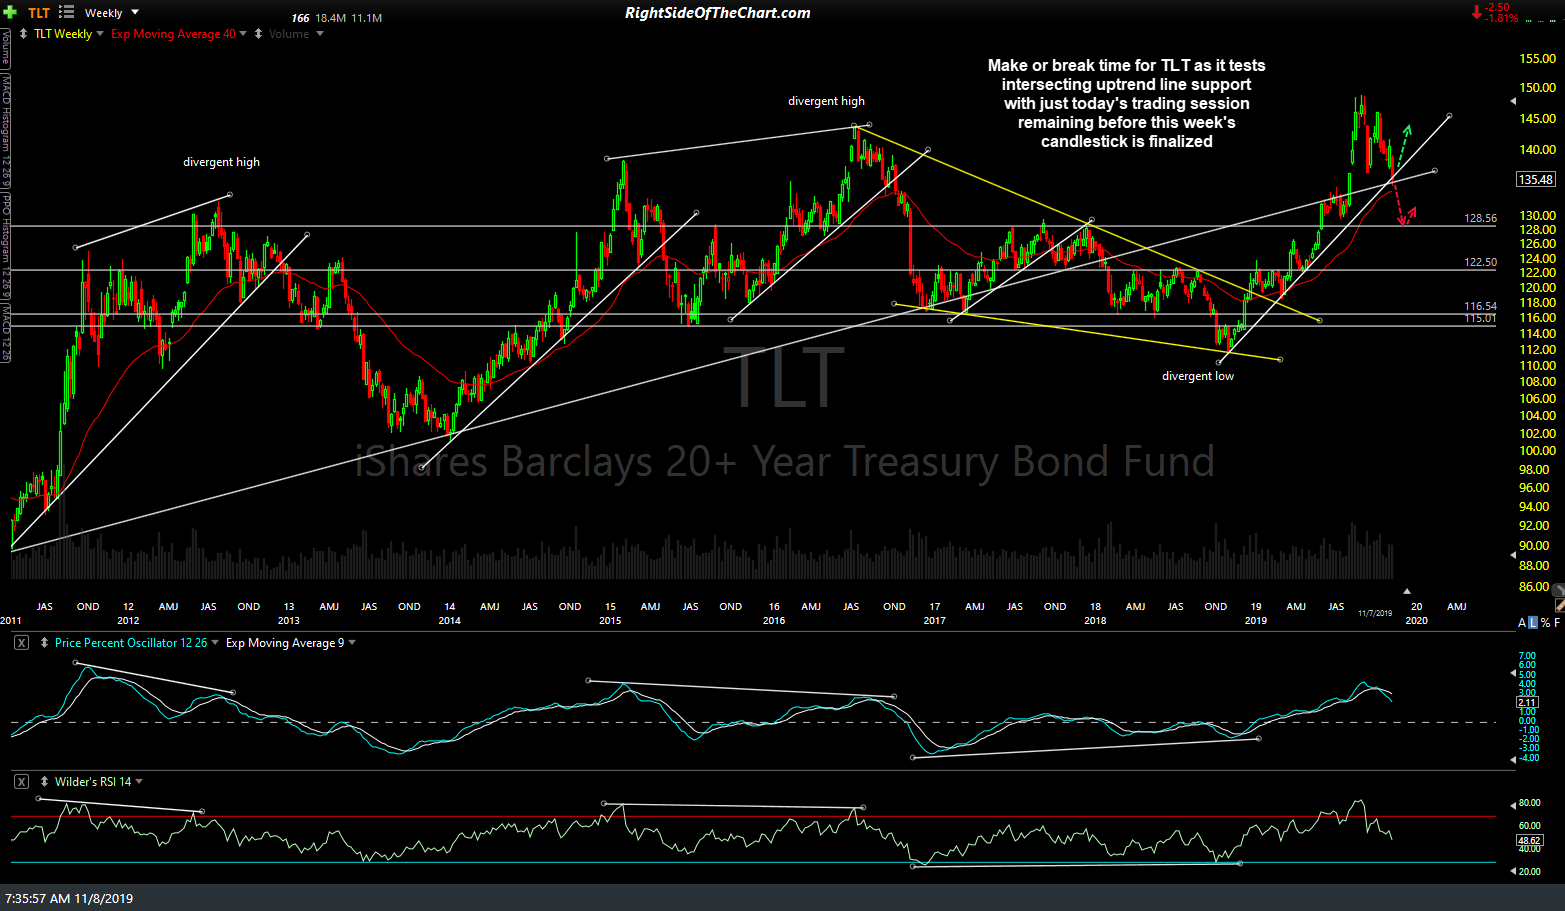
TLT weekly Nov 8th close
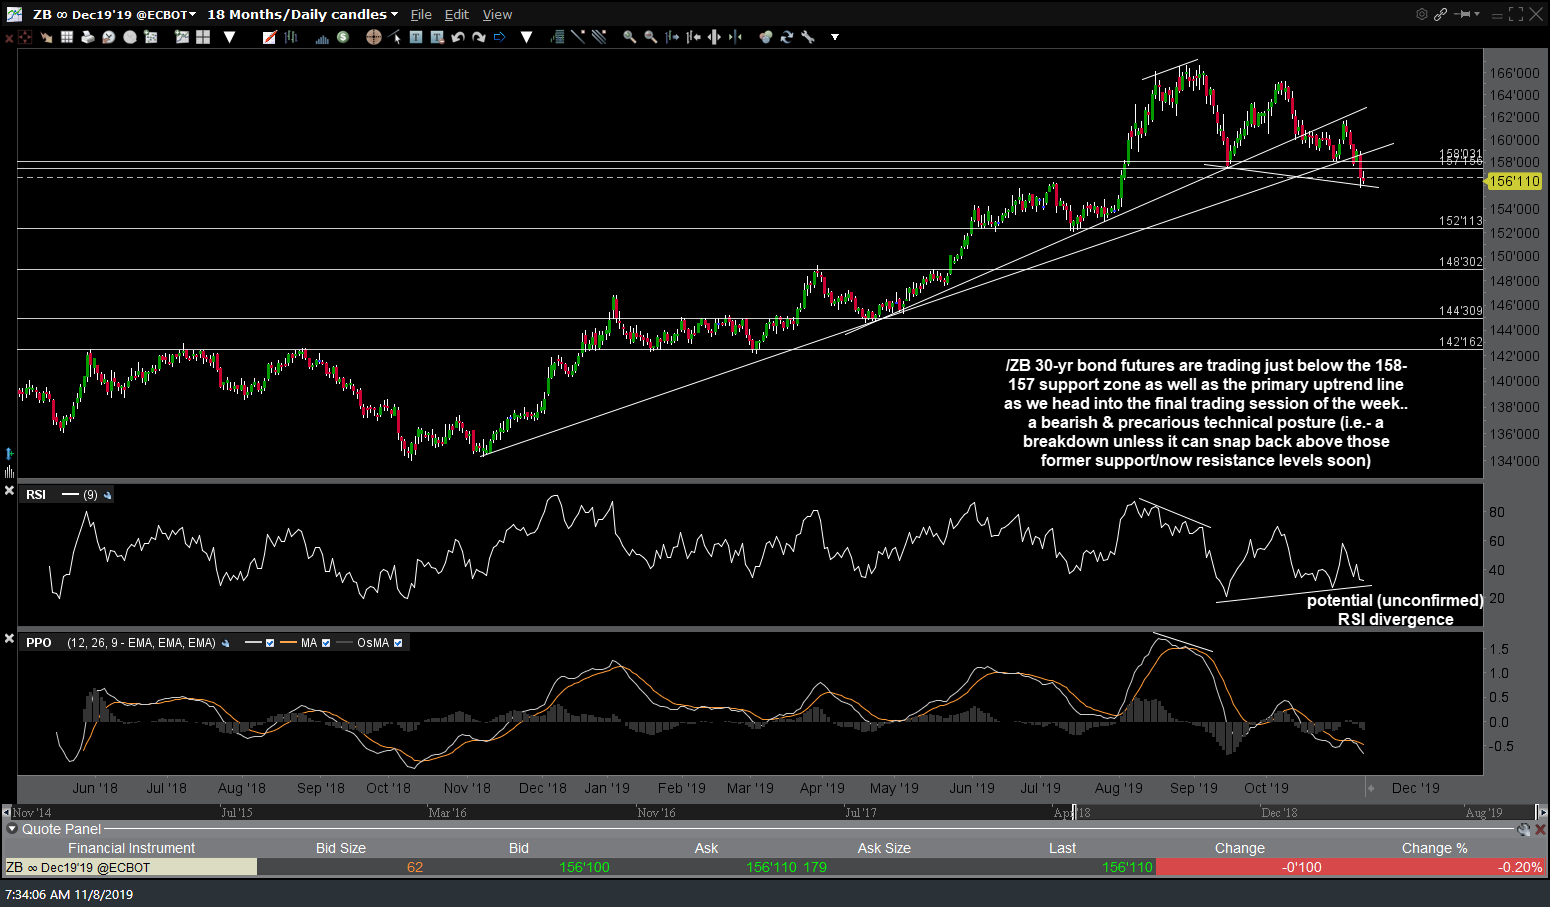
/ZB 30-yr bond futures are trading just below the 158-157 support zone as well as the primary uptrend line as we head into the final trading session of the week… a bearish & precarious technical posture (i.e.- a breakdown unless it can snap back above those former support/now resistance levels soon). Daily chart:
ZB 60m Nov 8th
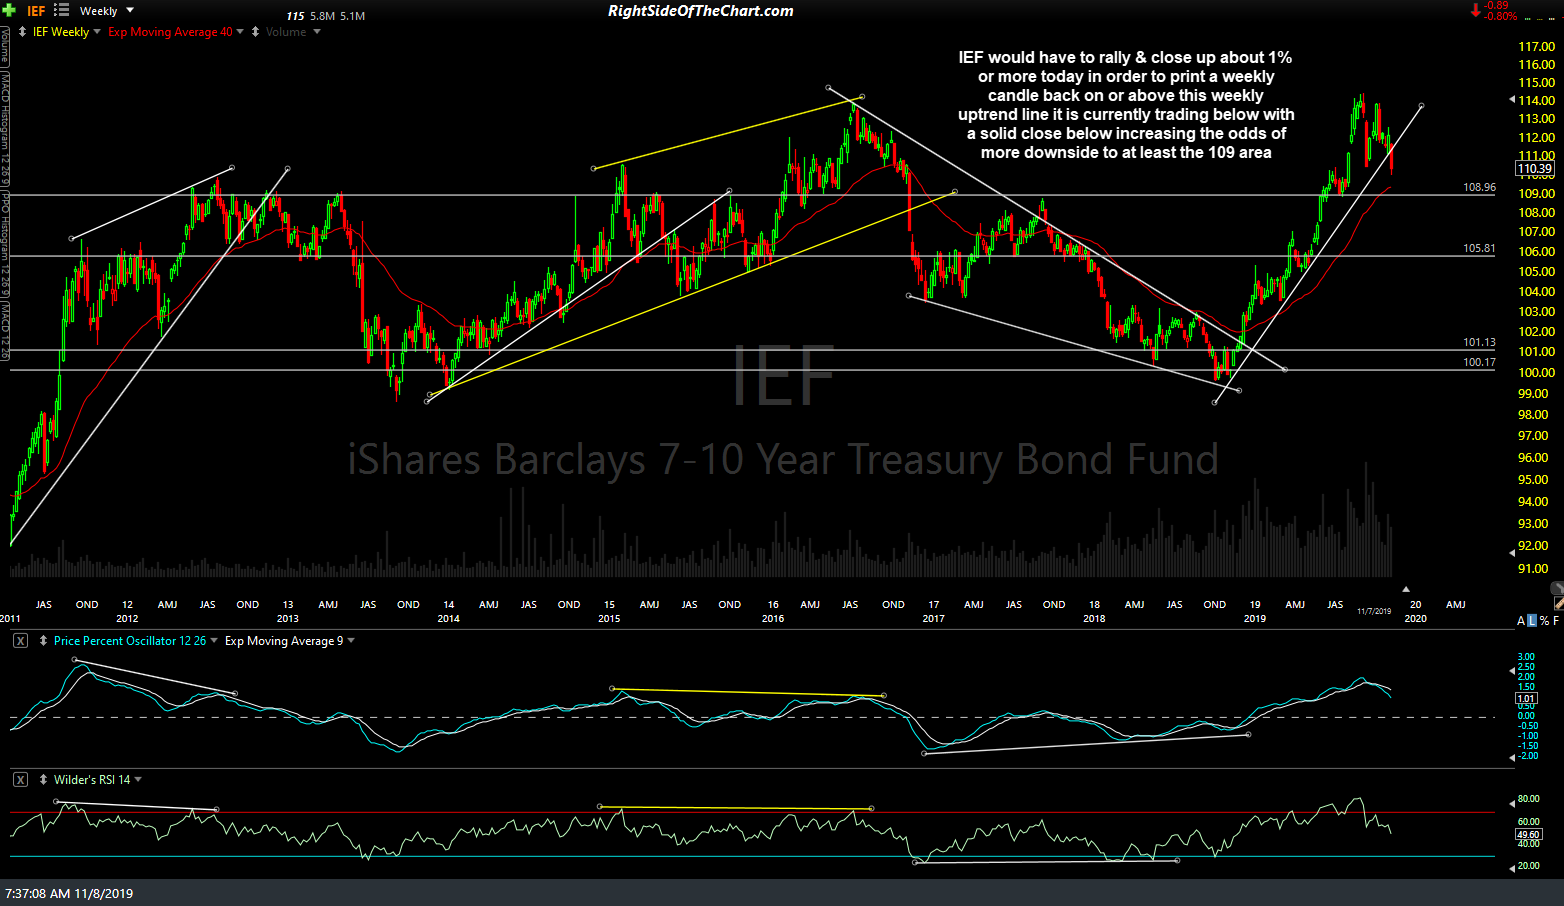
IEF (7-10 yr Treasury Bond ETF) would have to rally & close up about 1% or more today in order to print a weekly candle back on or above this weekly uptrend line it is currently trading below with a solid close below increasing the odds of more downside to at least the 109 area. Weekly chart:
IEF weekly Nov 7th close
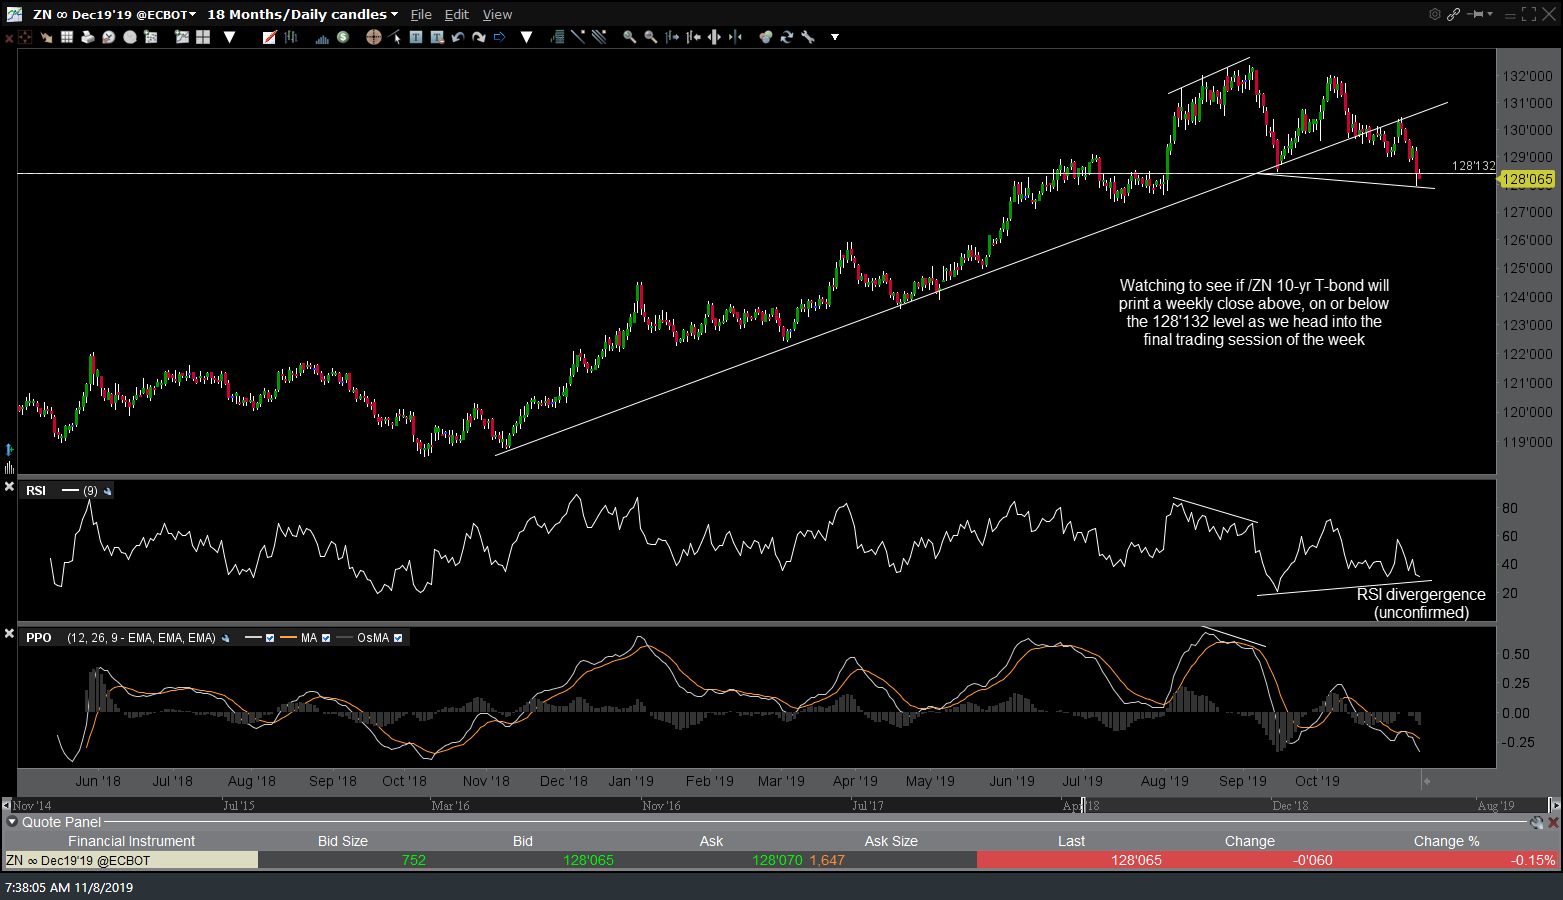
Watching to see if /ZN (10-yr T-bond futures) will print a weekly close above, on or below the 128’132 level as we head into the final trading session of the week. Daily chart:
ZN daily Nov 8th
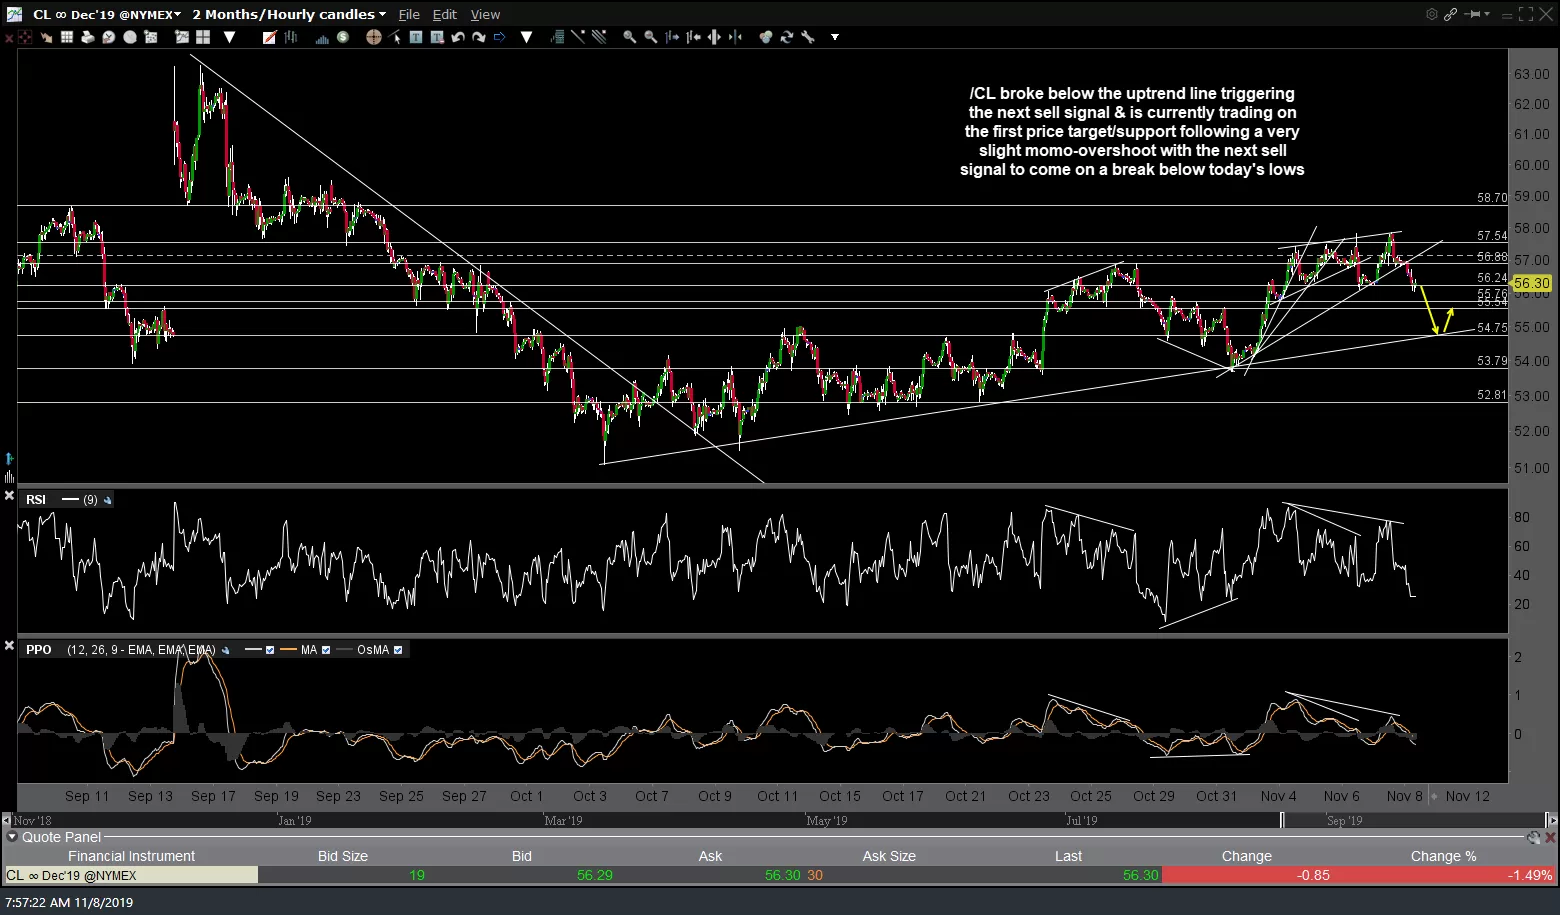
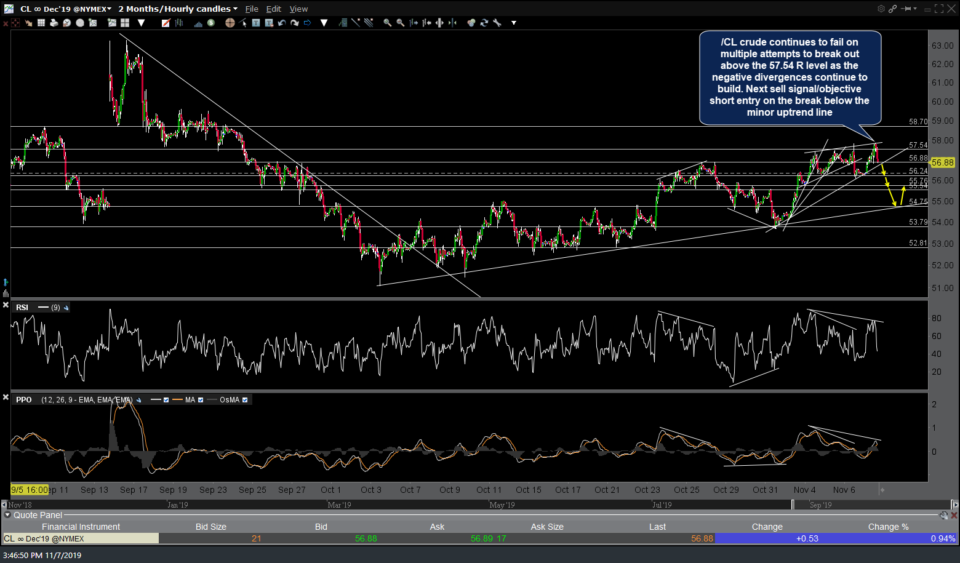
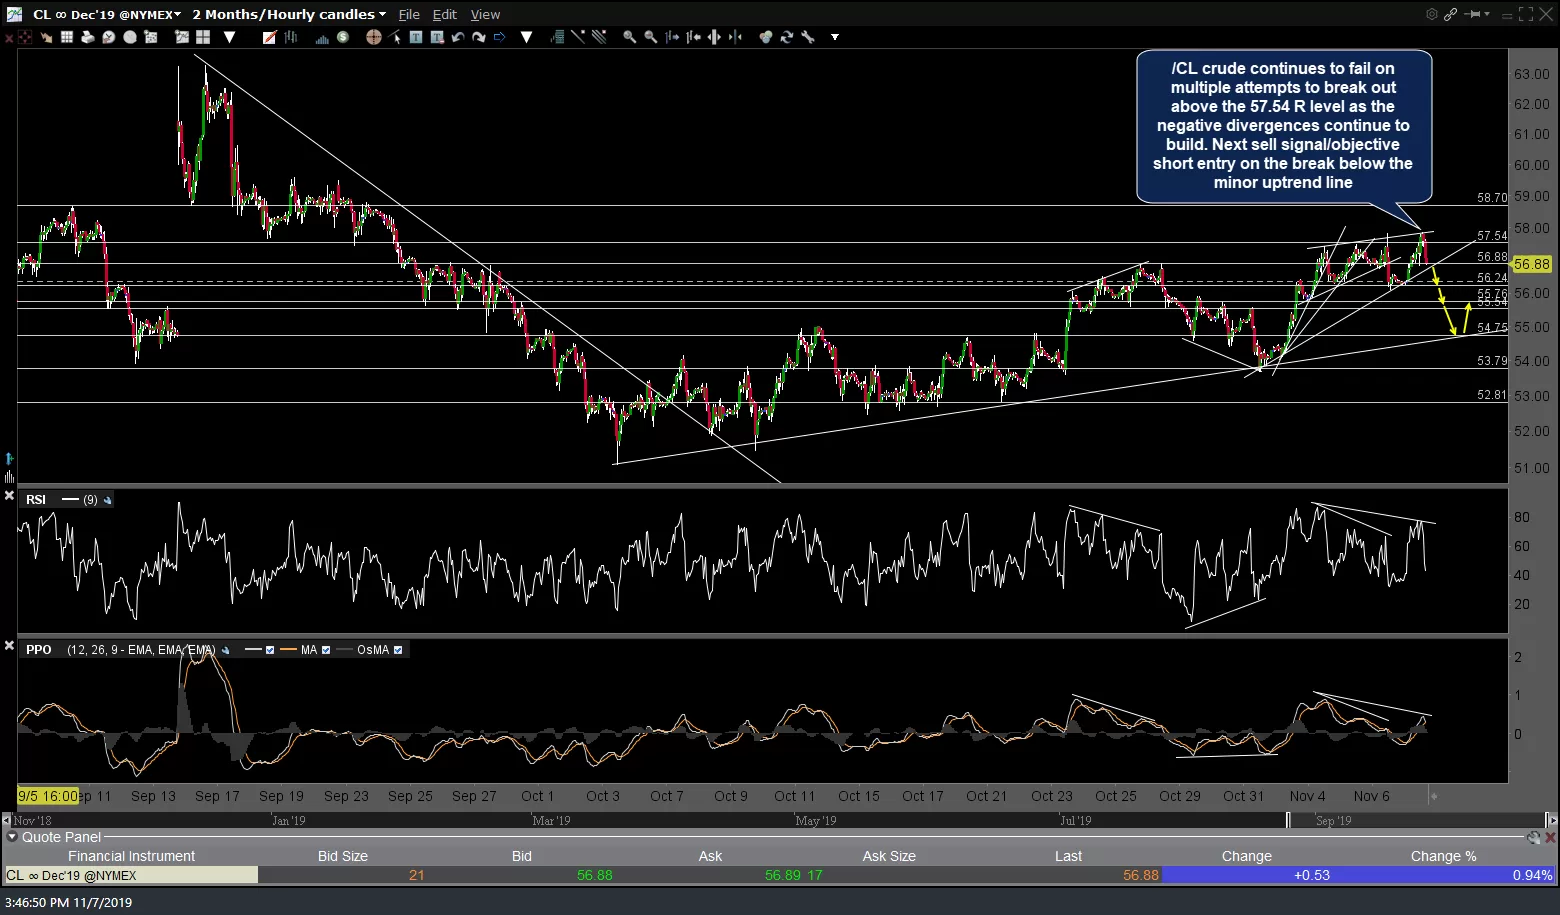
/CL (crude futures) broke below the uptrend line triggering the next sell signal & is currently trading on the first price target/support following a very slight momo-overshoot with the next sell signal to come on a break below today’s lows. Previous (yesterday’s) and today’s updated 60-minute charts below.
-
- CL 60m Nov 7th
-

- CL 60m Nov 8th