
Stock futures took a round-trip last night with a near-vertical plunge of about 1.75% nearly immediately followed by an almost equal vertical rip to bring them back to just below where they started. Doing so slightly undercut the previous reaction lows to put in a divergent low (i.e.- positive divergence between price & the momentum indicators). Typically, positive divergences on the 60-minute time frame that come during a correction are followed by significant rallies & quite often mark the end of the correction with the market going to new highs from there (during a primary/larger bullish trend).
However, should the stock indices fail to break out above the key nearby overhead resistance levels (in blue) on these 60-minute charts, instead going on to impulsively undercut the recent lows, that would be quite bearish as it would indicate the market is most likely still well within a downtrend with much more downside to come. Should the divergences continue to play out for more upside off last night’s lows, the catalysts for additional upside would be a break of the minor downtrend line just overhead on /ES followed by a break of the intersecting 2935 resistance level & larger downtrend line.
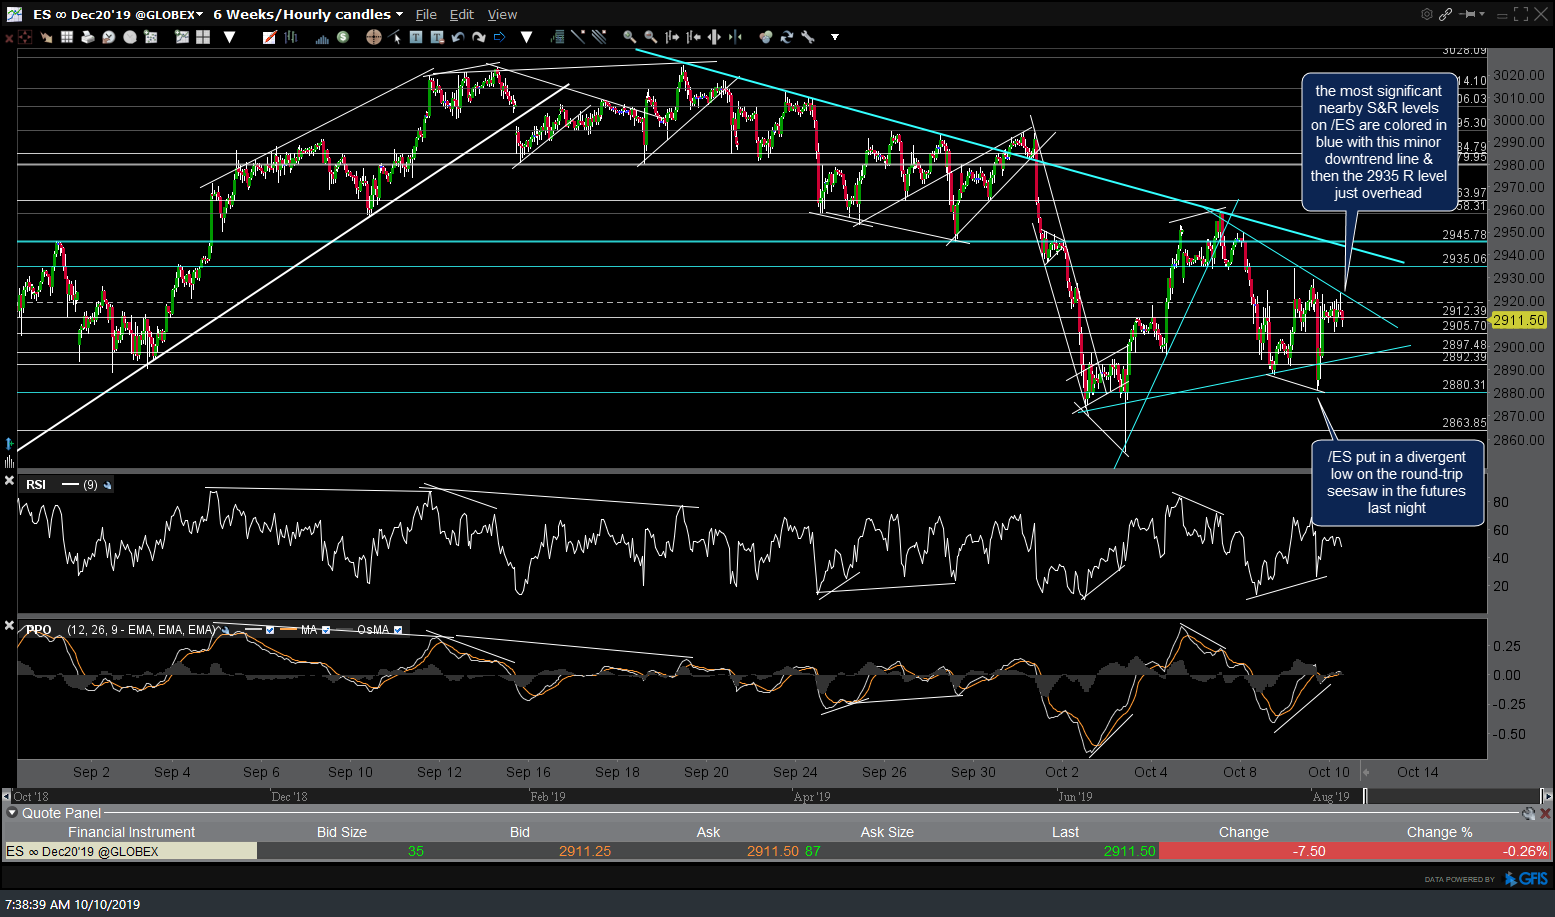
ES 60m Oct 10th
Nearby resistance levels that could spark additional upside in /NQ if taken out remain that key 7722 resistance level which has capped every advance since that former support level was taken out impulsively on Tuesday, as well as the roughly interesting downtrend line off the Sept 19th highs. Although I favor more downside with a resumption of the current near-term bearish trend, my convictions aren’t very high right now and the market can most certainly break either way in the near-term. As such, it would be best to keep positions sizes light & remain flexible (ready to reverse short to long, long to short or go to cash if unsure how to be positioned) as the bigger picture has the indexes still flirting with key support on the more significant daily charts & as such, less-active swing traders might opt to wait for be visibility on the daily & weekly charts.
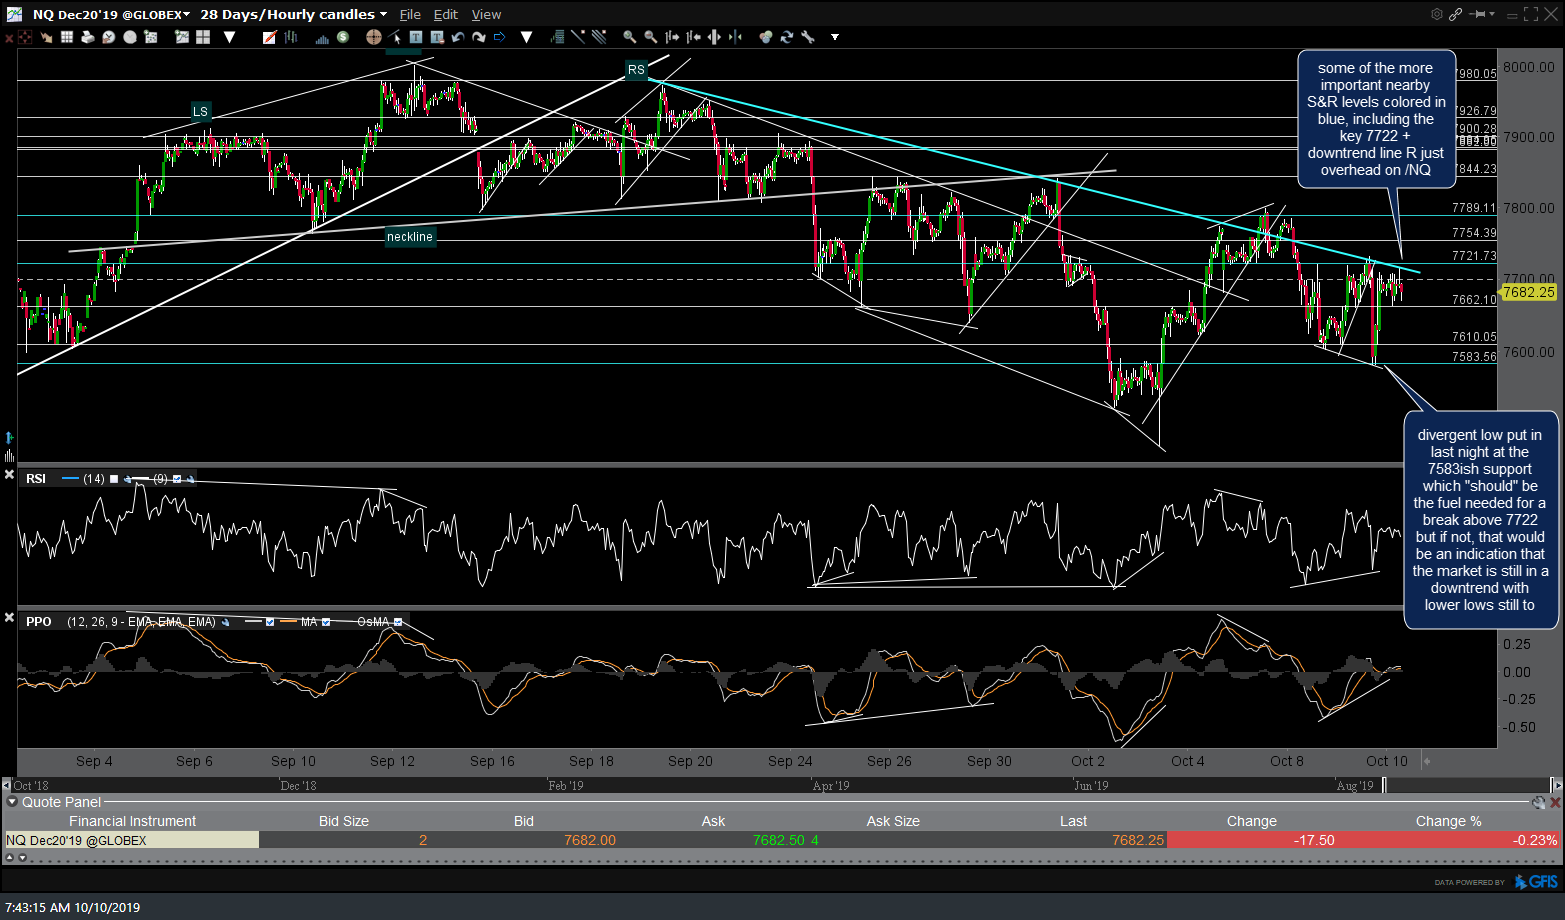
NQ 60m Oct 10th
/GC gold is at the apex of the triangle pattern with an upside break likely if the market takes another leg down today & a downside break if the indexes can break the resistance levels just above & rally from there. As the lead sled dog, the rest of the precious metals (silver, platinum, palladium) will more or less follow gold’s lead so my primary focus is on both gold & the equity markets at this time. 60-minute chart below.
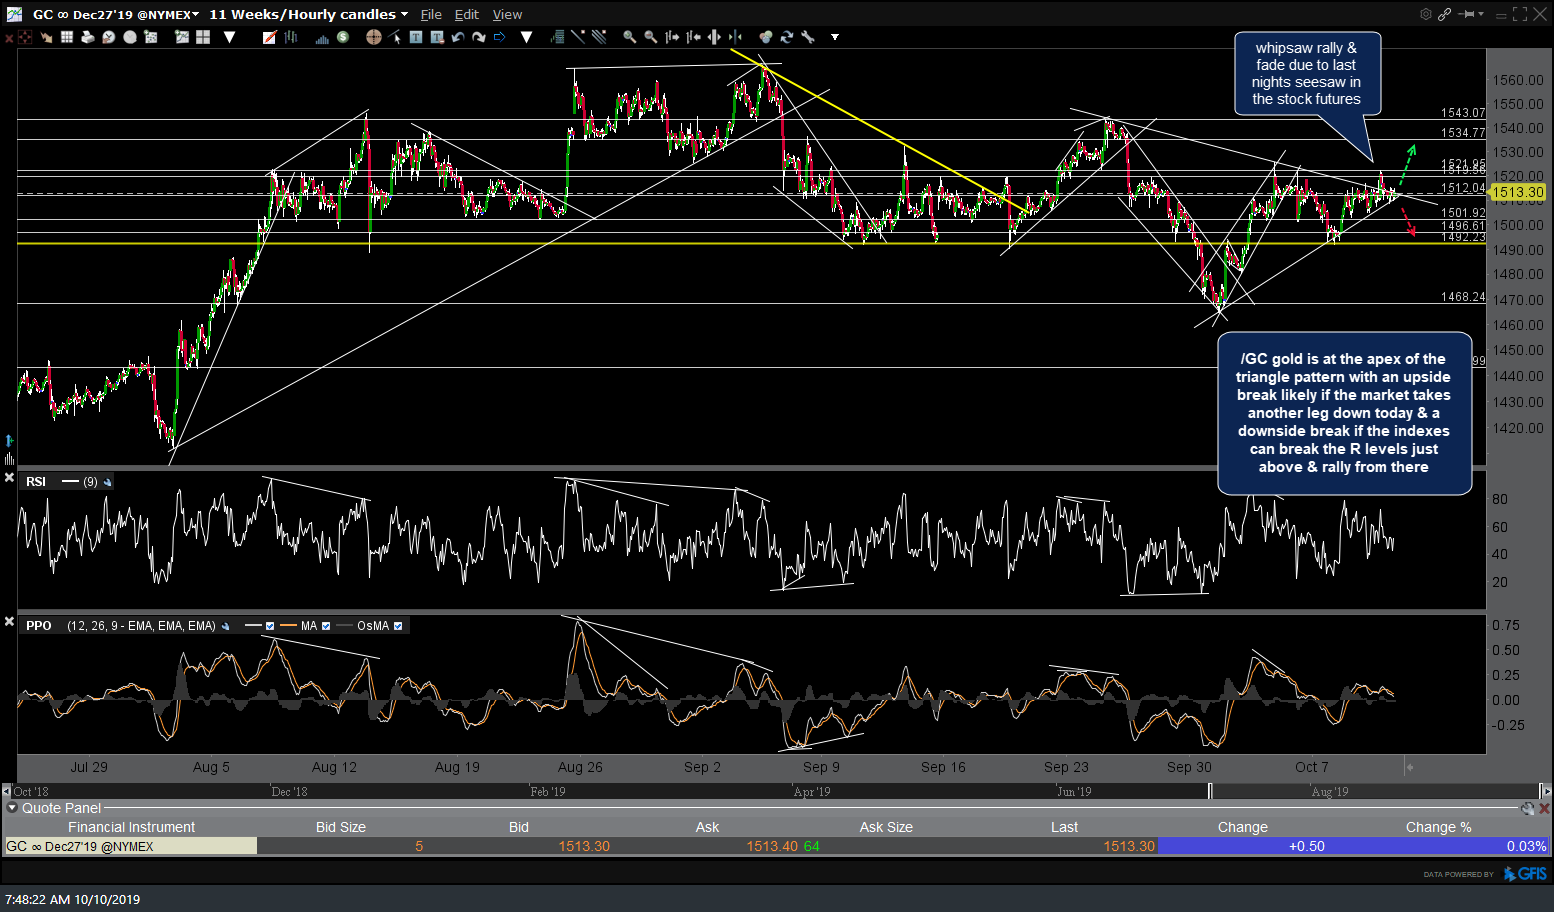
GC 60m Oct 10th
/KC still offers an objective long entry following the breakout & backtest of the falling wedge & reversal right off the 0.9291 support so far although it should be noted that a lot of the agricultural commodities, including coffee, have been & remain in near-term downtrends. As such, this should be considered a counter-trend (and still unofficial) trade & as always, stops are not an option. 60-minute chart below. (Price targets & comparble S&R level on the coffee ETN, JO, can be viewed in yesterday’s Charts I’m Watching post which is accessible by clicking on either the ‘JO’ or ‘/KC’ symbol tags located below this post).
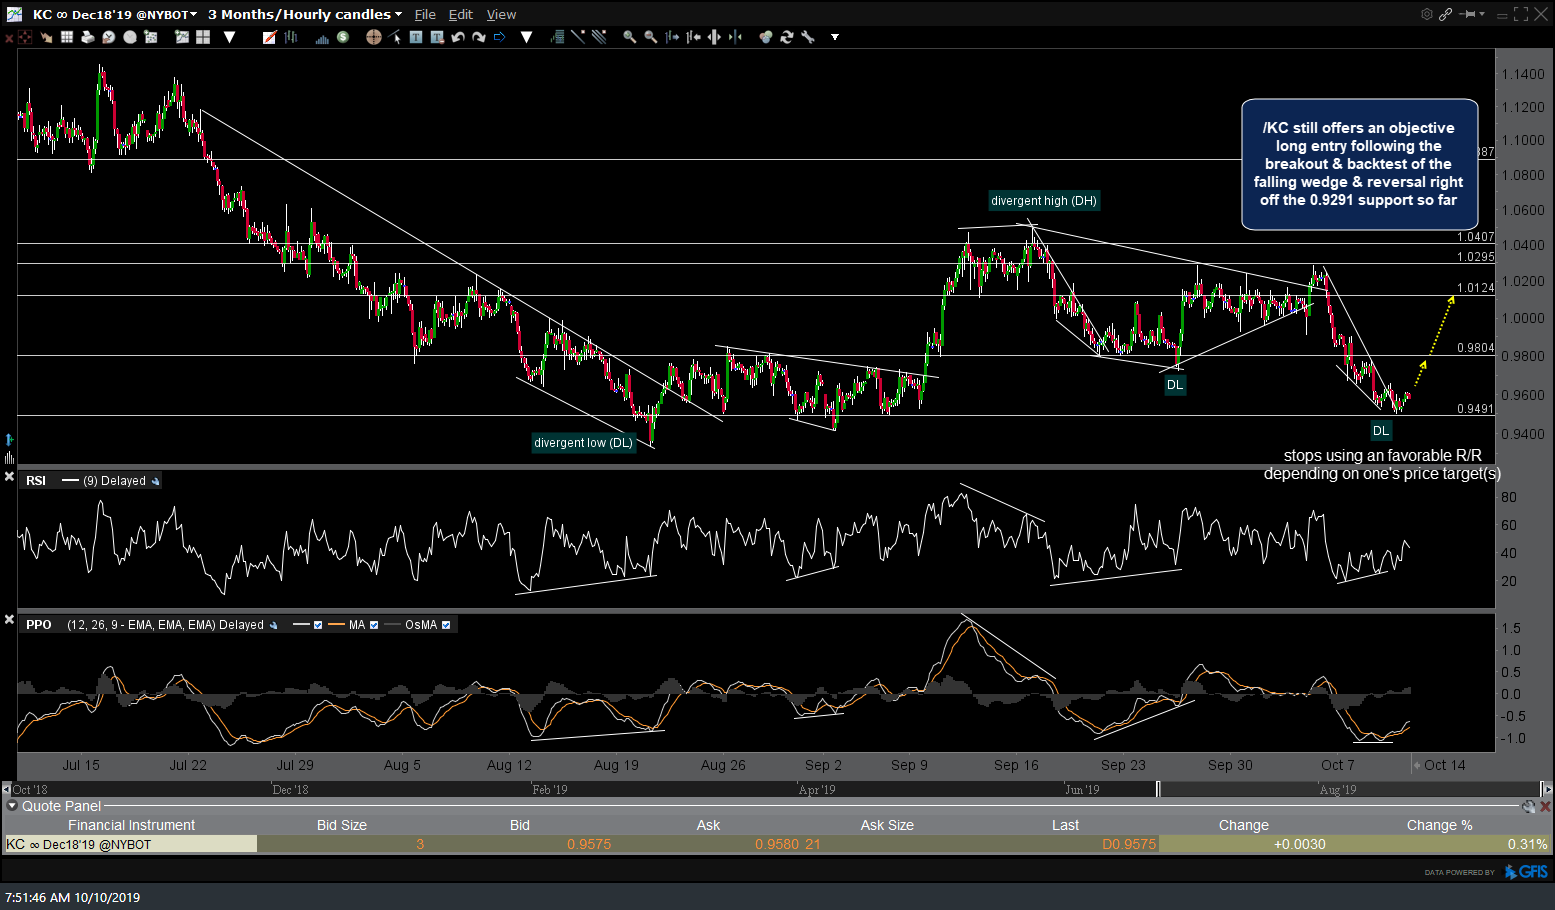
KC 60m Oct10th