
QQQ is coming up on the top of the Feb 23rd-March 3rd trading range (resistance) with minor uptrend line support just below on the daily time frame.

QQQ daily March 16th
Negative divergences continue to build on the IWM (Russell 2000 Small-Cap ETF) daily chart.

IWM daily March 16th
/RTY (R2k futures) remains below the uptrend line/rising wedge pattern with the next sell signal to come on a break below this minor support level.
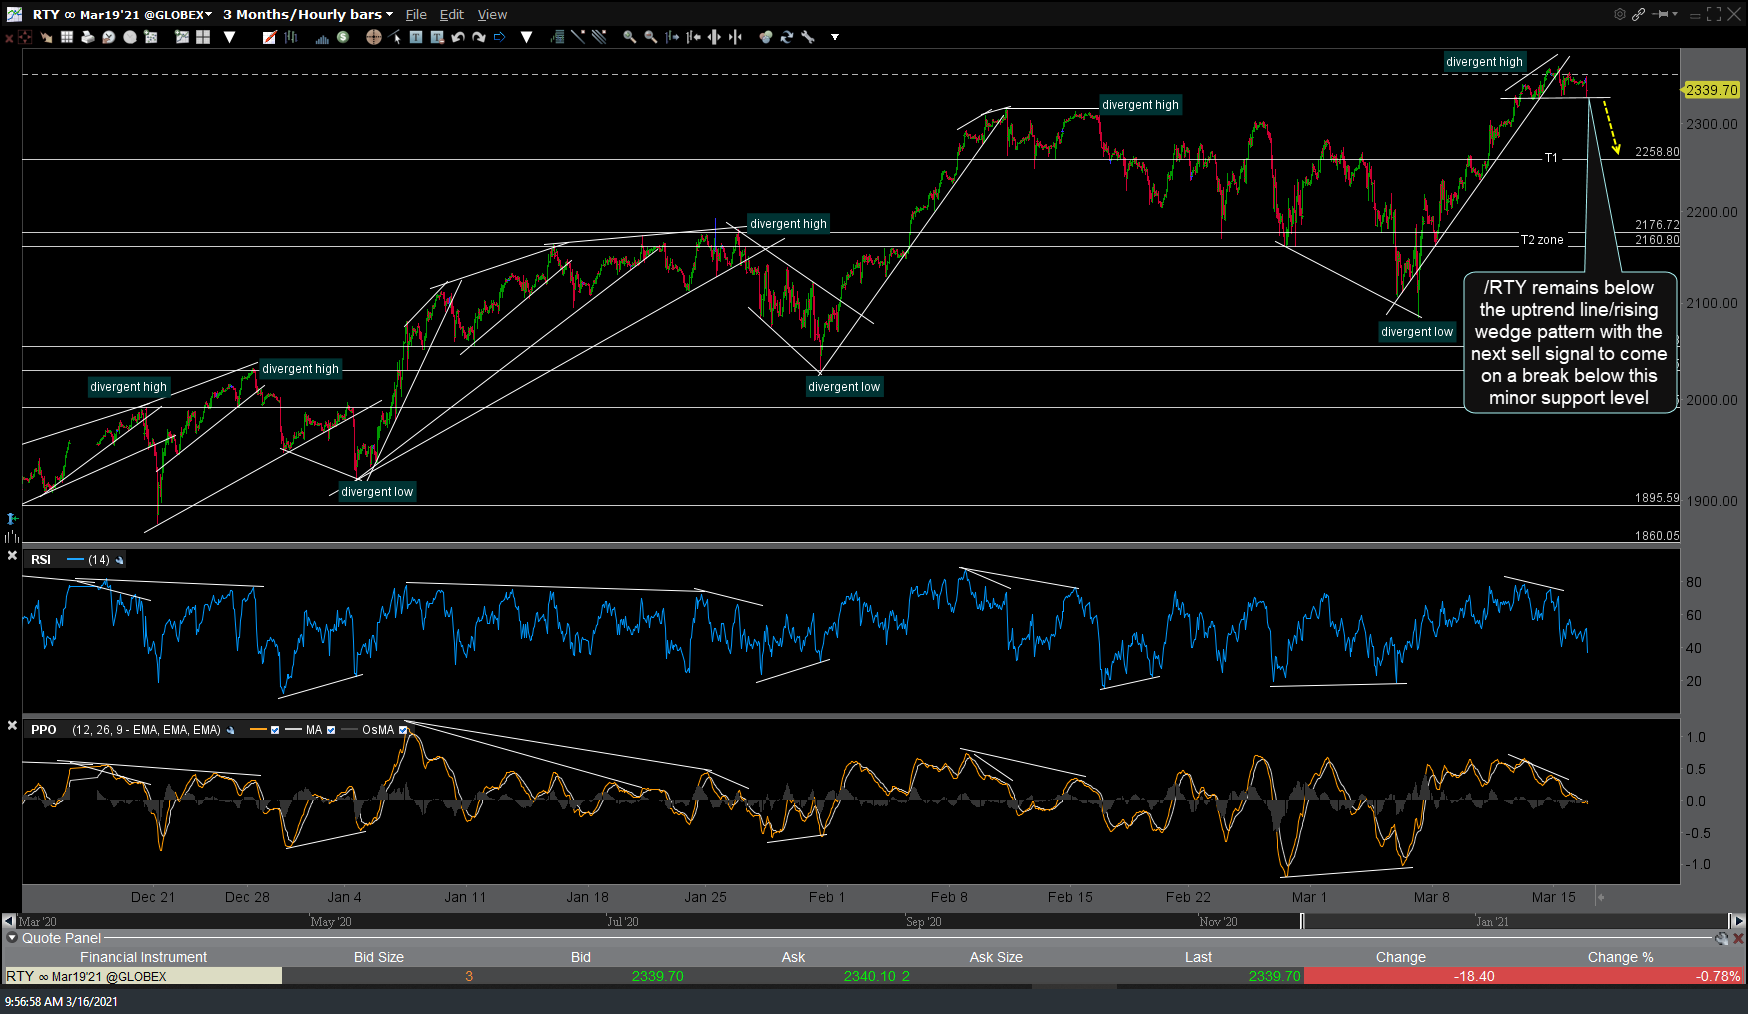
RTY 60m March 16th
/CL (crude oil futures) is testing the 63.79 support with last Wed’s reaction low as the next support below, both of which will increase the odds of T1 and T2 being hit if/when taken out & likely dragging down the energy sector (XLE, XOP, XES, etc..) down along with it. 60-minute chart below.
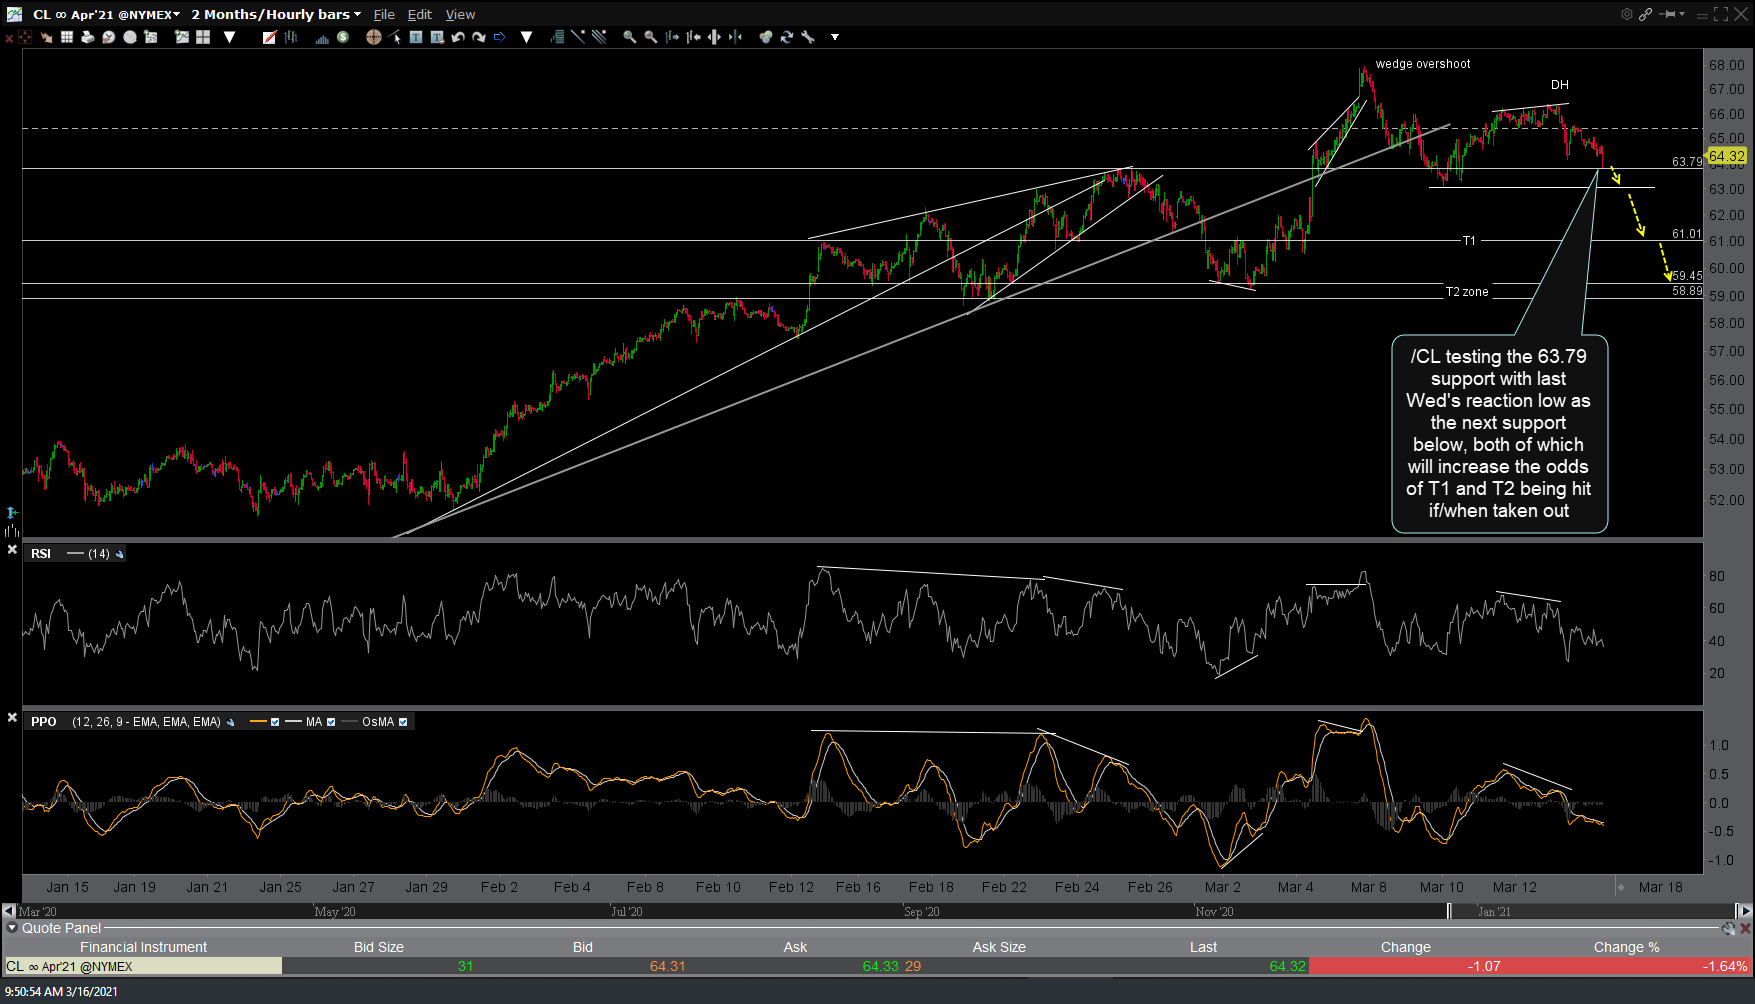
CL 60m March 16th
/GC (gold futures) has minor resistance here around the 1736 level with a solid break above likely to trigger the next leg higher. 60-minute chart below.
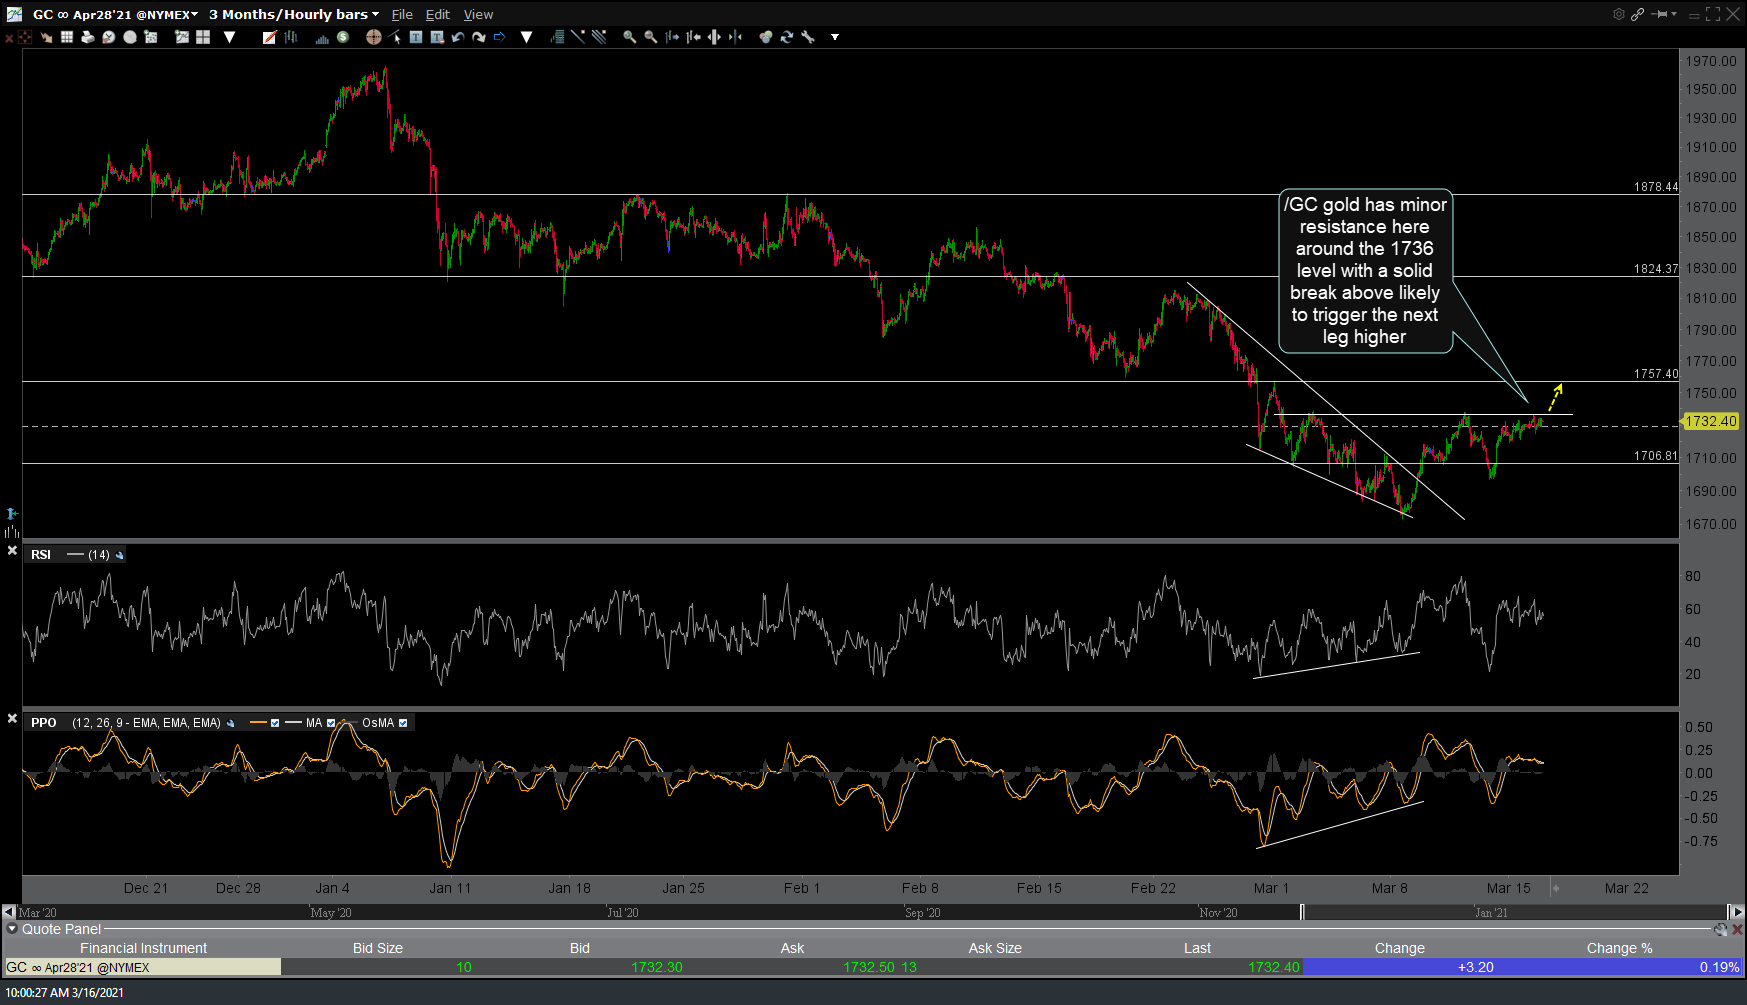
GC 60m March 16th