
The following charts are some, but not all, of what I believe to be some of the most significant levels & potential developments to watch for in the financial markets at this time, starting with the Nasdaq 100. /NQ is currently testing the downtrend line from below with the near & intermediate-term outlook still bearish, as long as it remains below, while bullish if it manages a solid breakout & daily close above (increasing the odds of my ‘marginal new high’ scenario). 120-minute chart below.
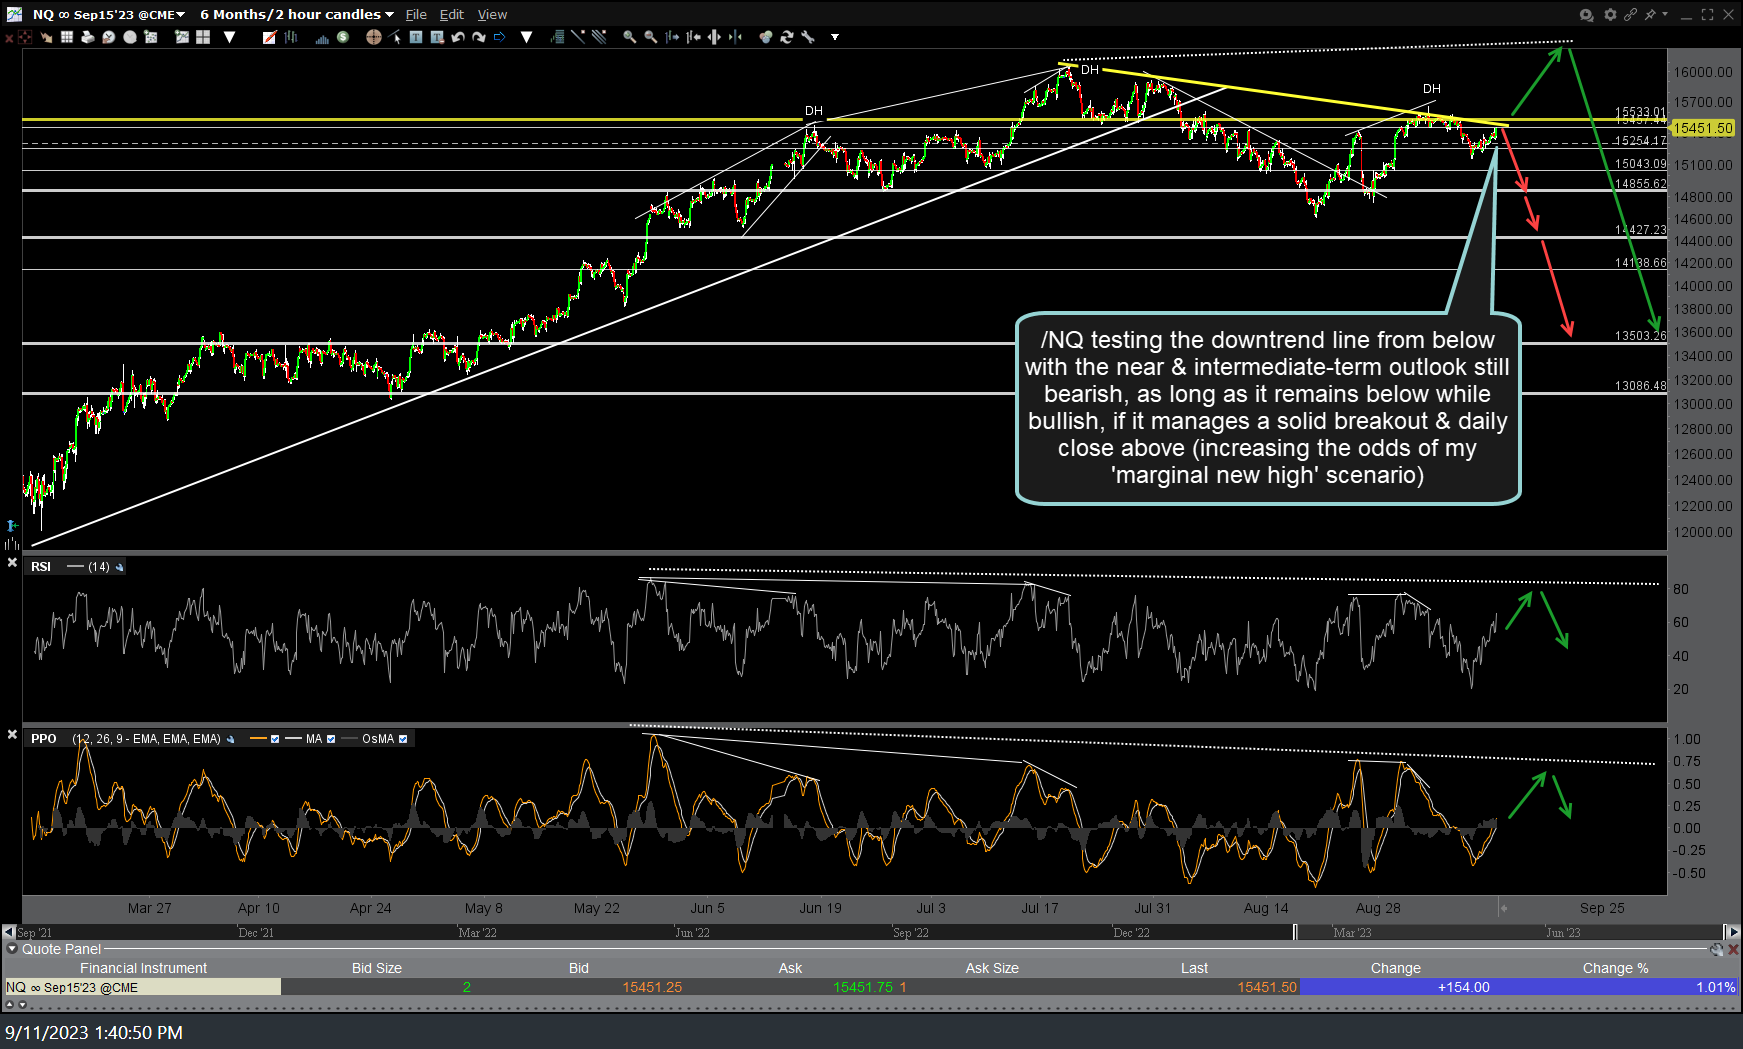
NQ 120m Sept 11th
EUR/USD continues to rally following Friday’s breakout with the positively correlated US stock market likely to rally along as the EUR/USD continues higher & vice versa, should this post-breakout rally get sold into as did the recent breakouts (circled) on this 60-minute chart.
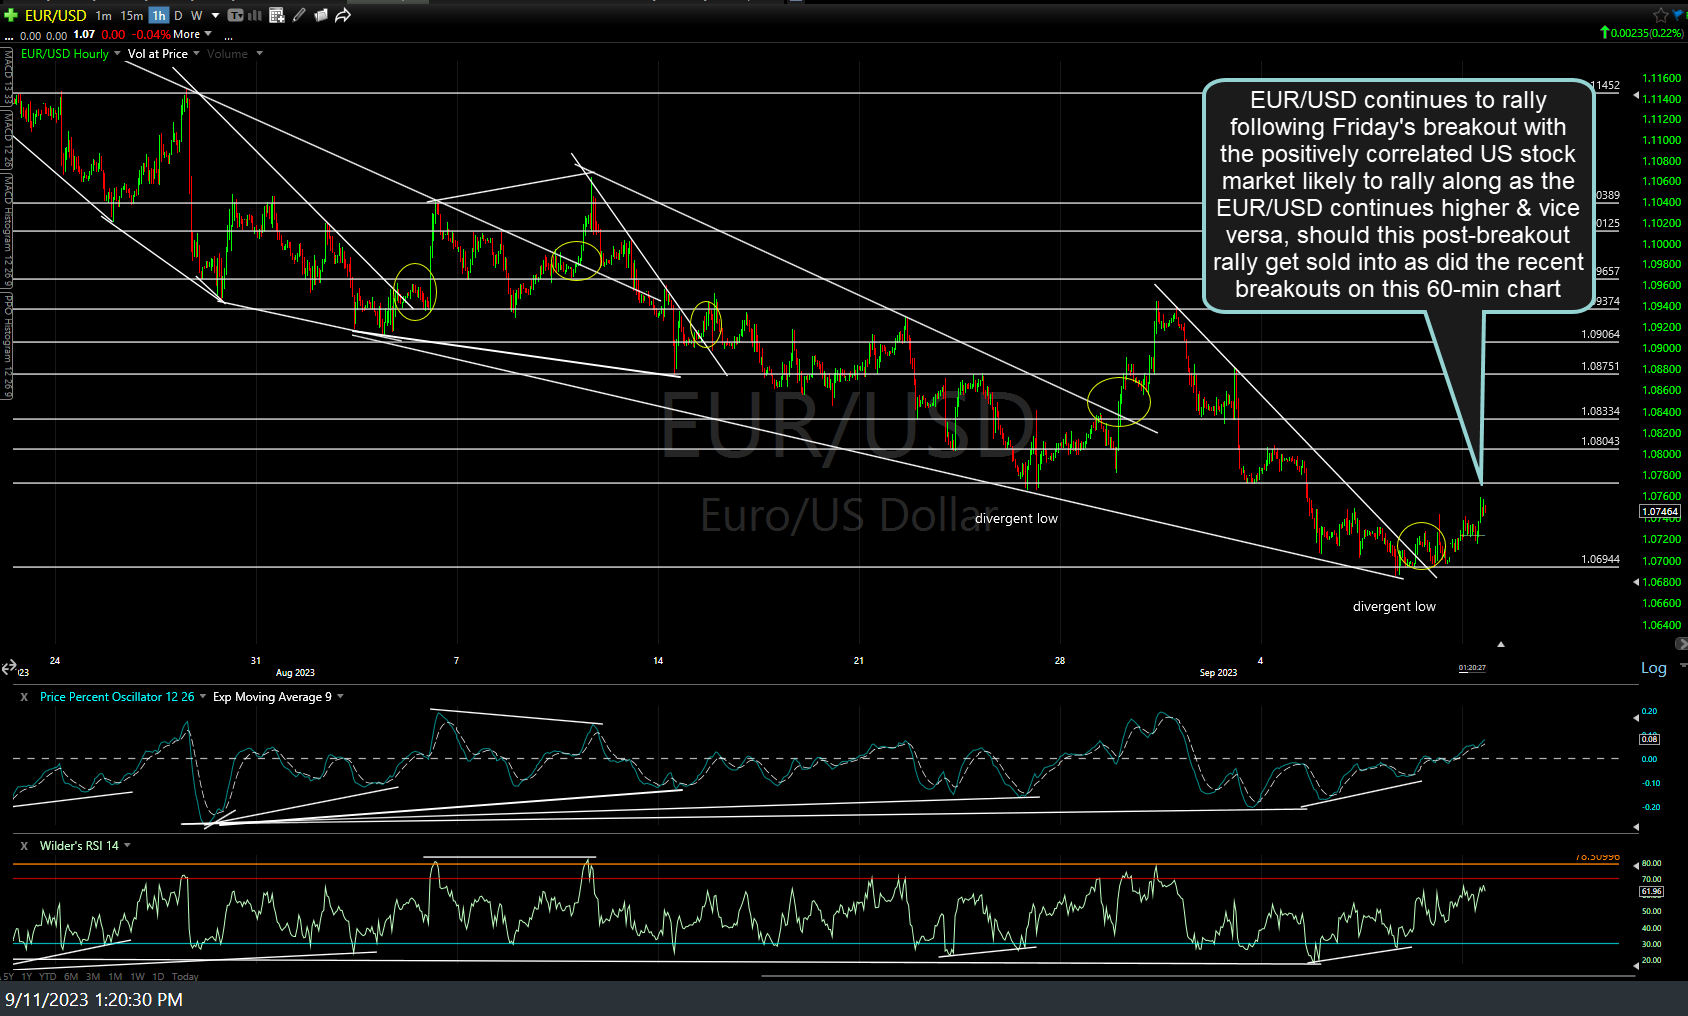
EUR-USD 60m Sept 11th
Each tick higher in commodity prices following the recent divergent low & breakout(s) puts additional pressure on the Fed to remain hawkish. Daily chart of DBC (broad-based commodity ETF) below.
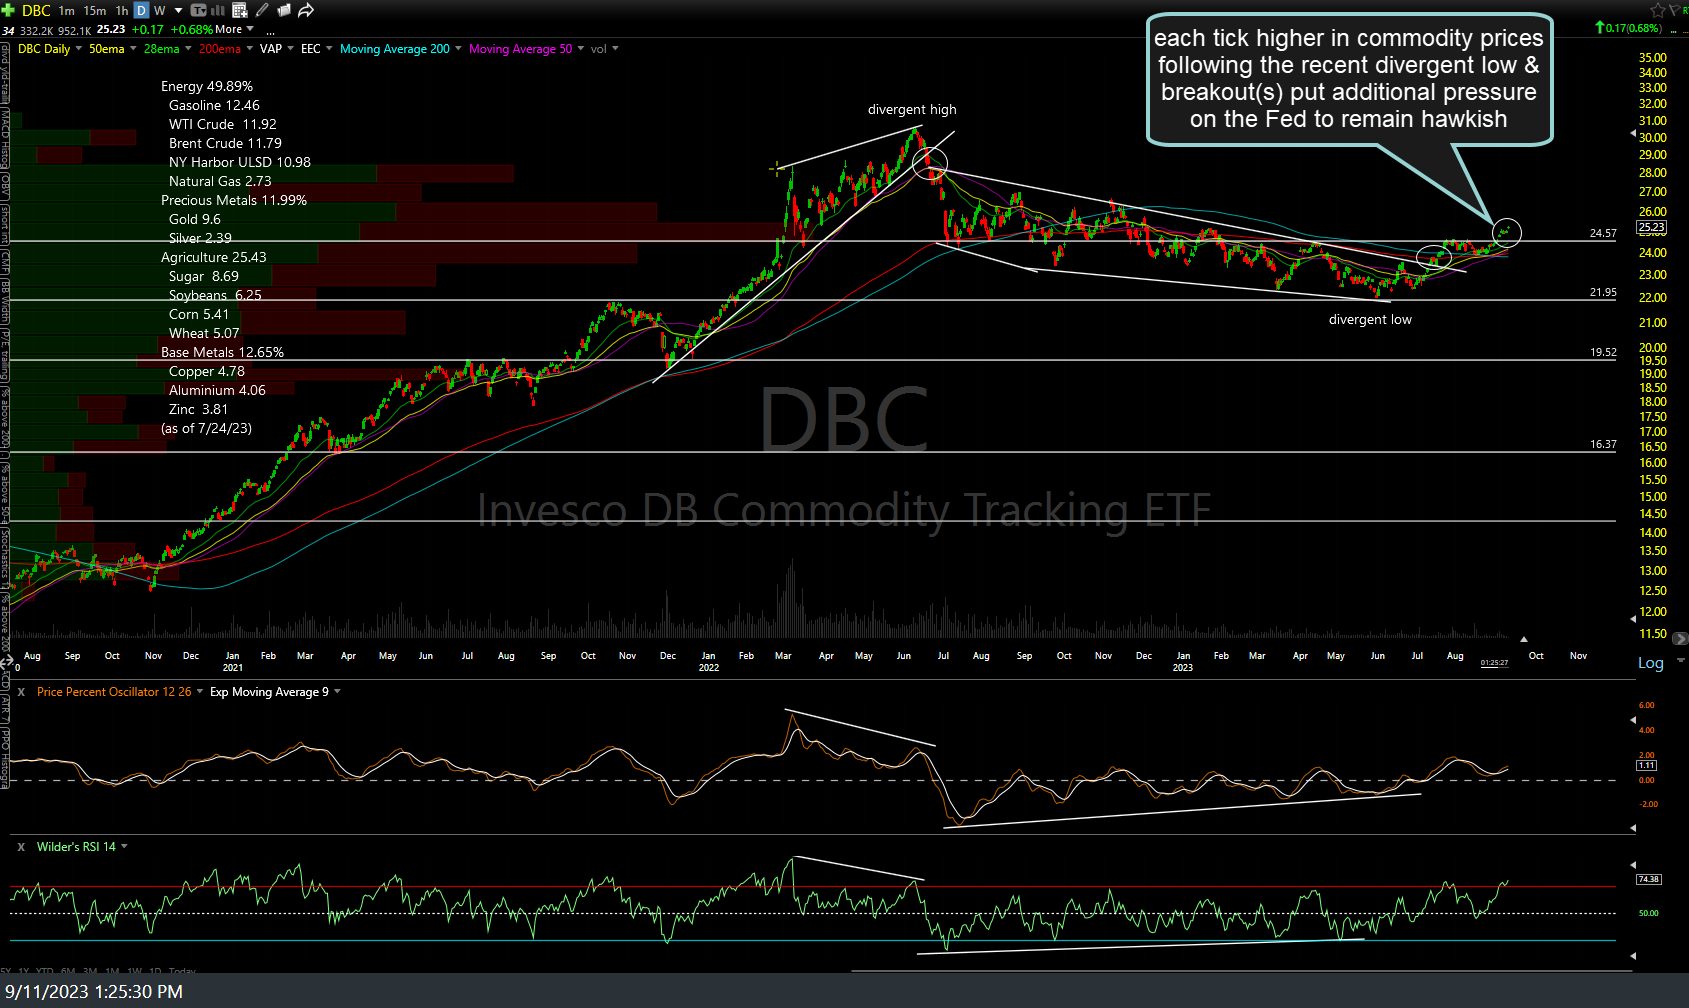
DBC daily Sept 11th
Still awaiting a break below the Aug 18th lows in AAPL (Apple Inc.) as well as SPY & QQQ to help decrease the odds of that ‘marginal new highs’ scenario in the stock market & increase the odds of another major down.
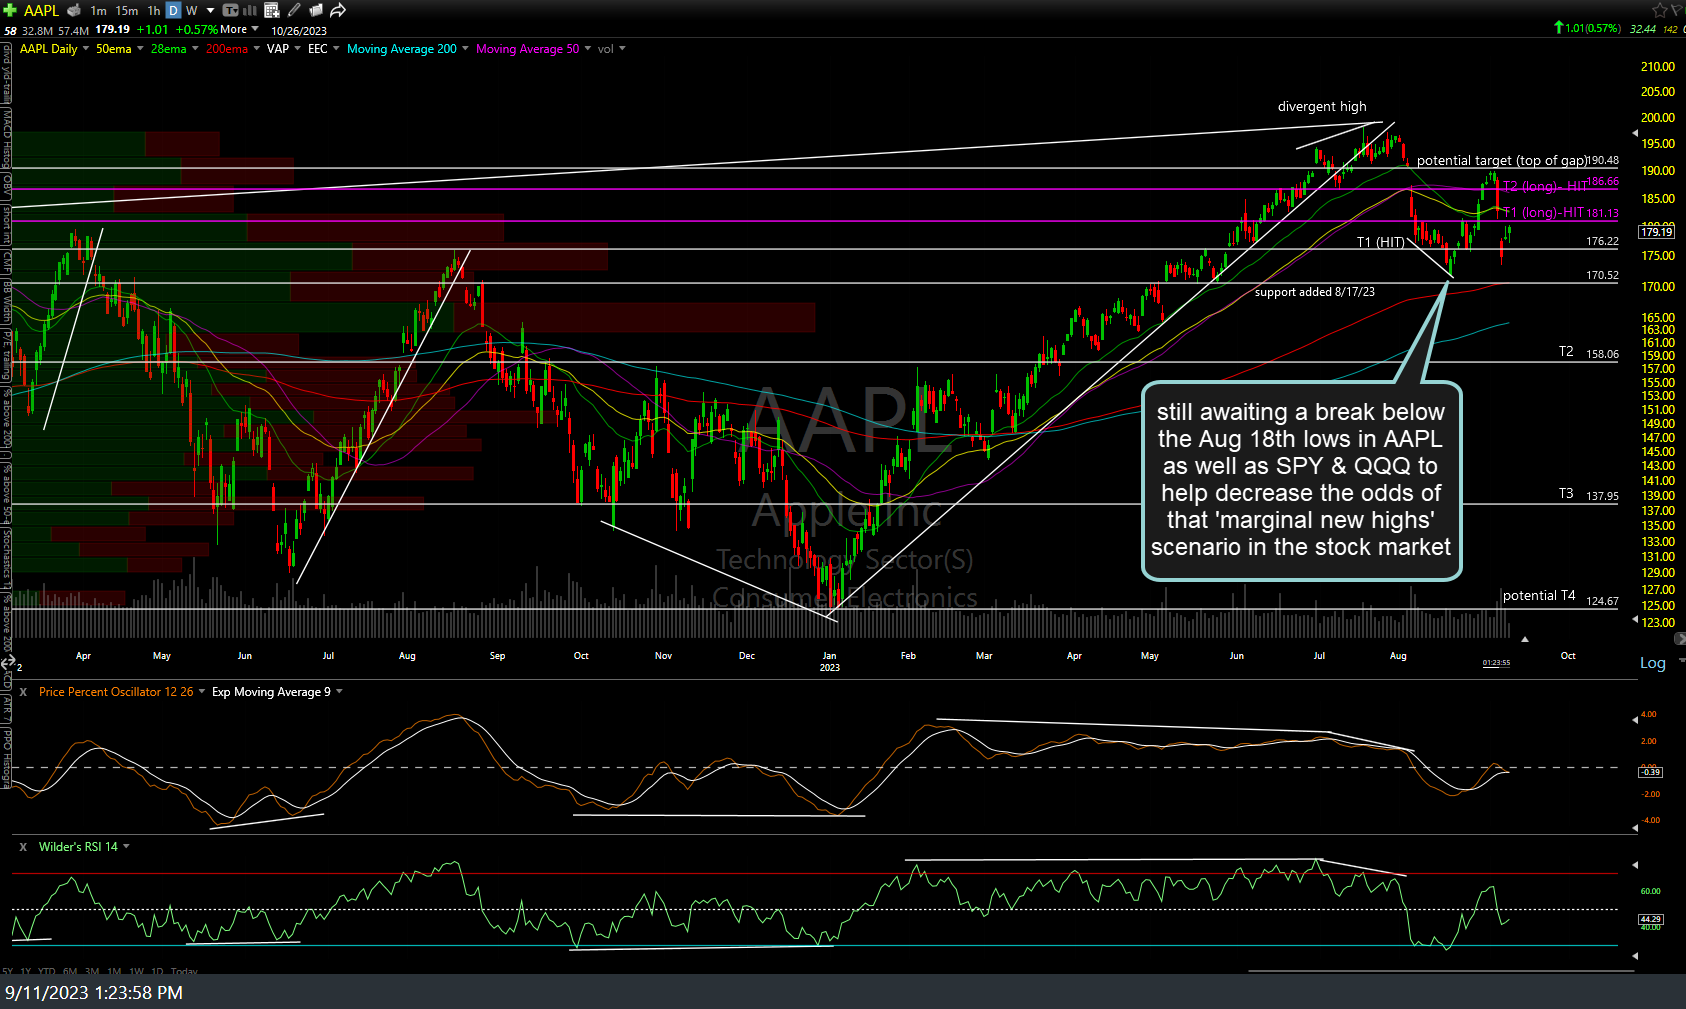
AAPL daily Sept 11th
SOXX (semiconductor sector ETF) is currently testing its primary uptrend line (support) with the next sell signal to come on a solid break and/or daily closed below it… although as I like to say; support is support until & unless broken. Daily chart below.
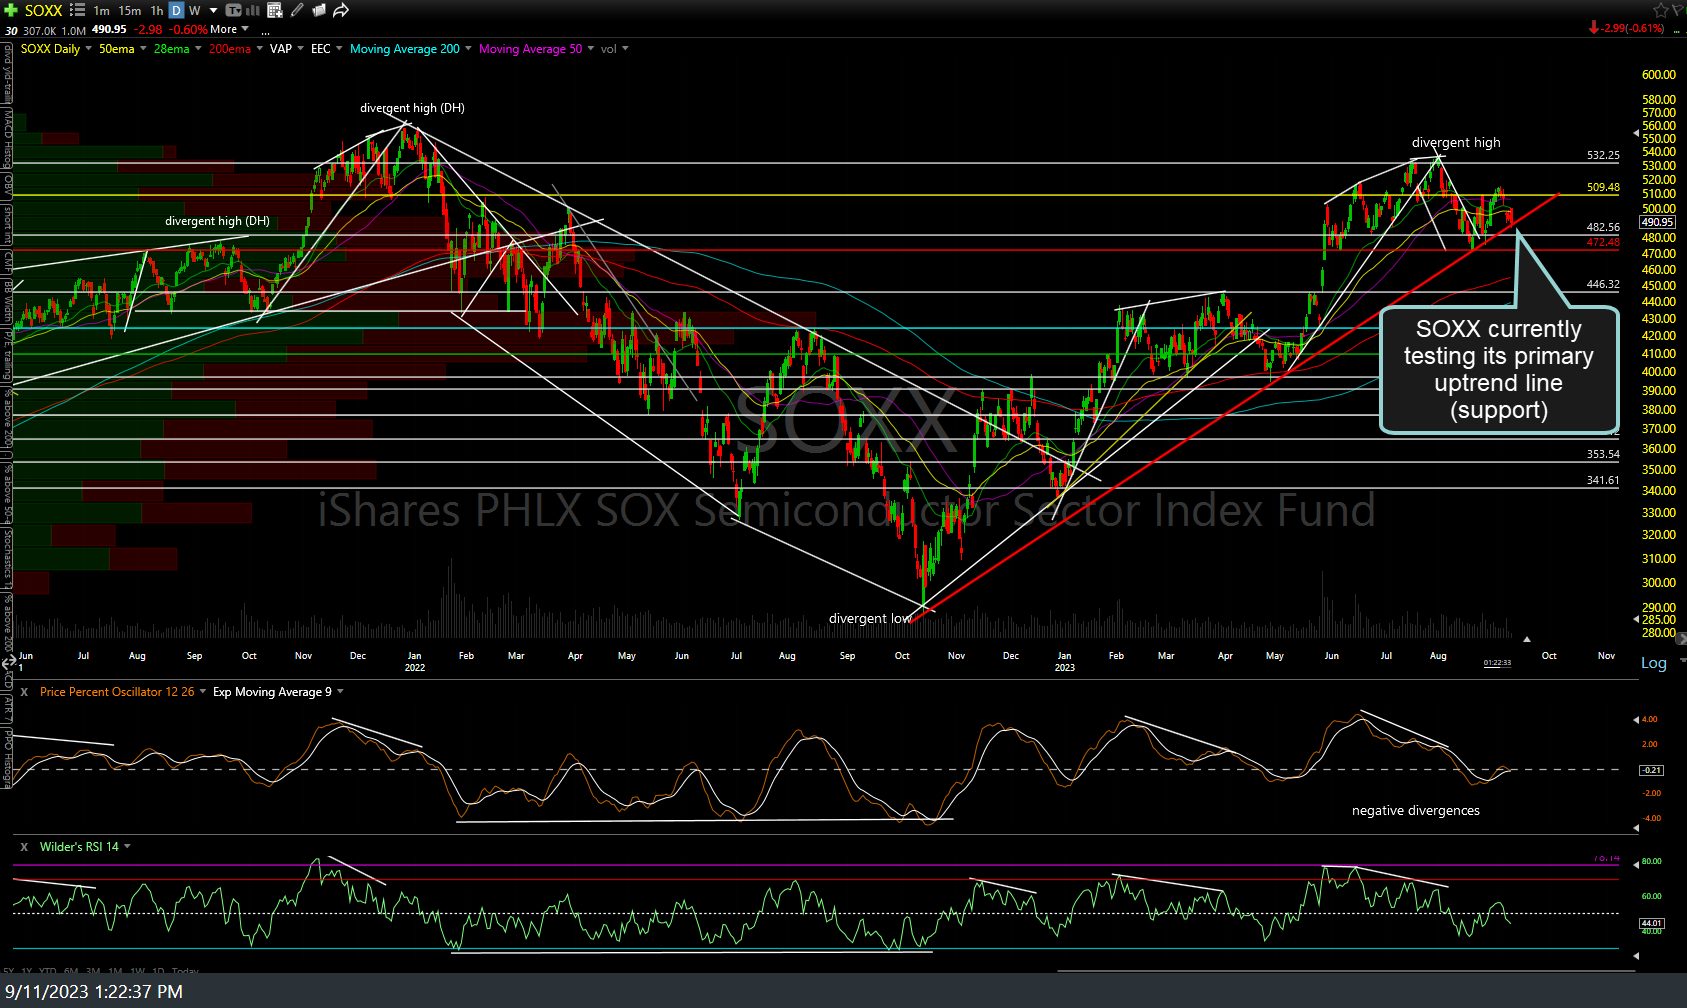
SOXX daily Sept 11th
JPM (JP Morgan Chase & Co.) is still trading solidly below the primary uptrend line but currently above the 144ish support with a break below Friday’s low needed to open the door to another leg down.
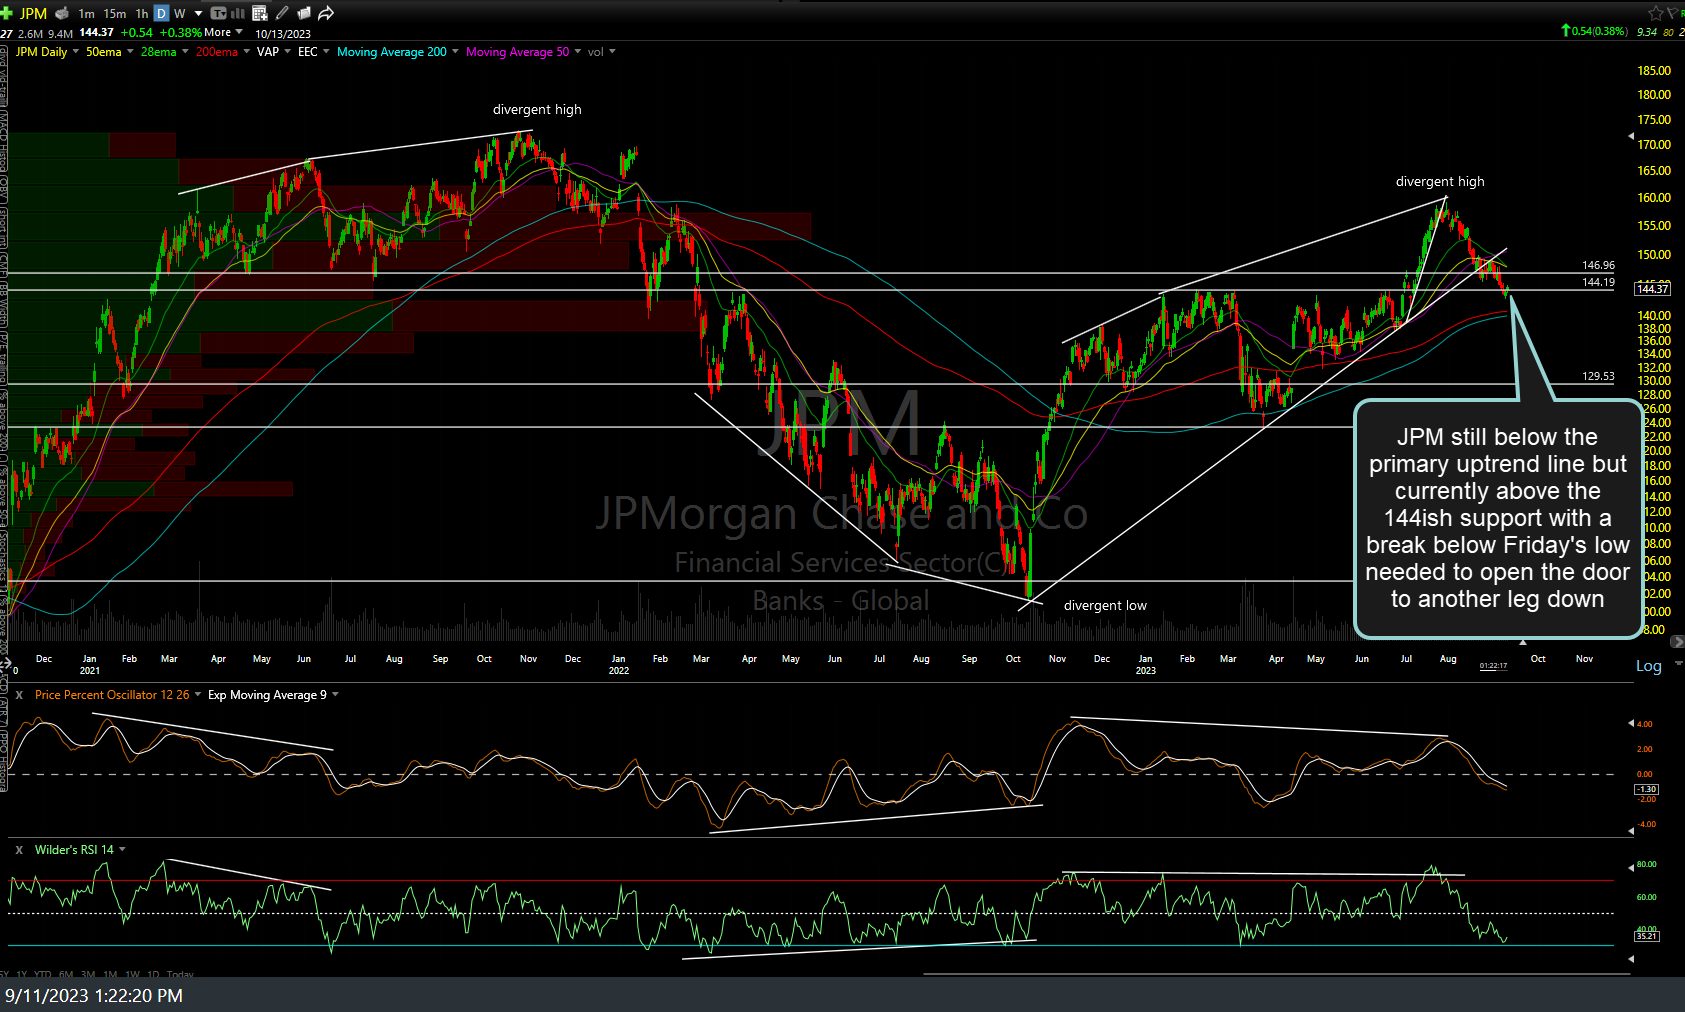
JPM daily Sept 11th
The 10-yr Treasury yield ($TNX) is pinched between its multi-year/decade+ highs & the primary uptrend line (support) below. The large negative divergences are still intact on this test of the 2022 high as they would be on any marginal new high soon, should $TNX break above the ’22 highs, increasing the odds that any upside breakout would fail shortly afterward.
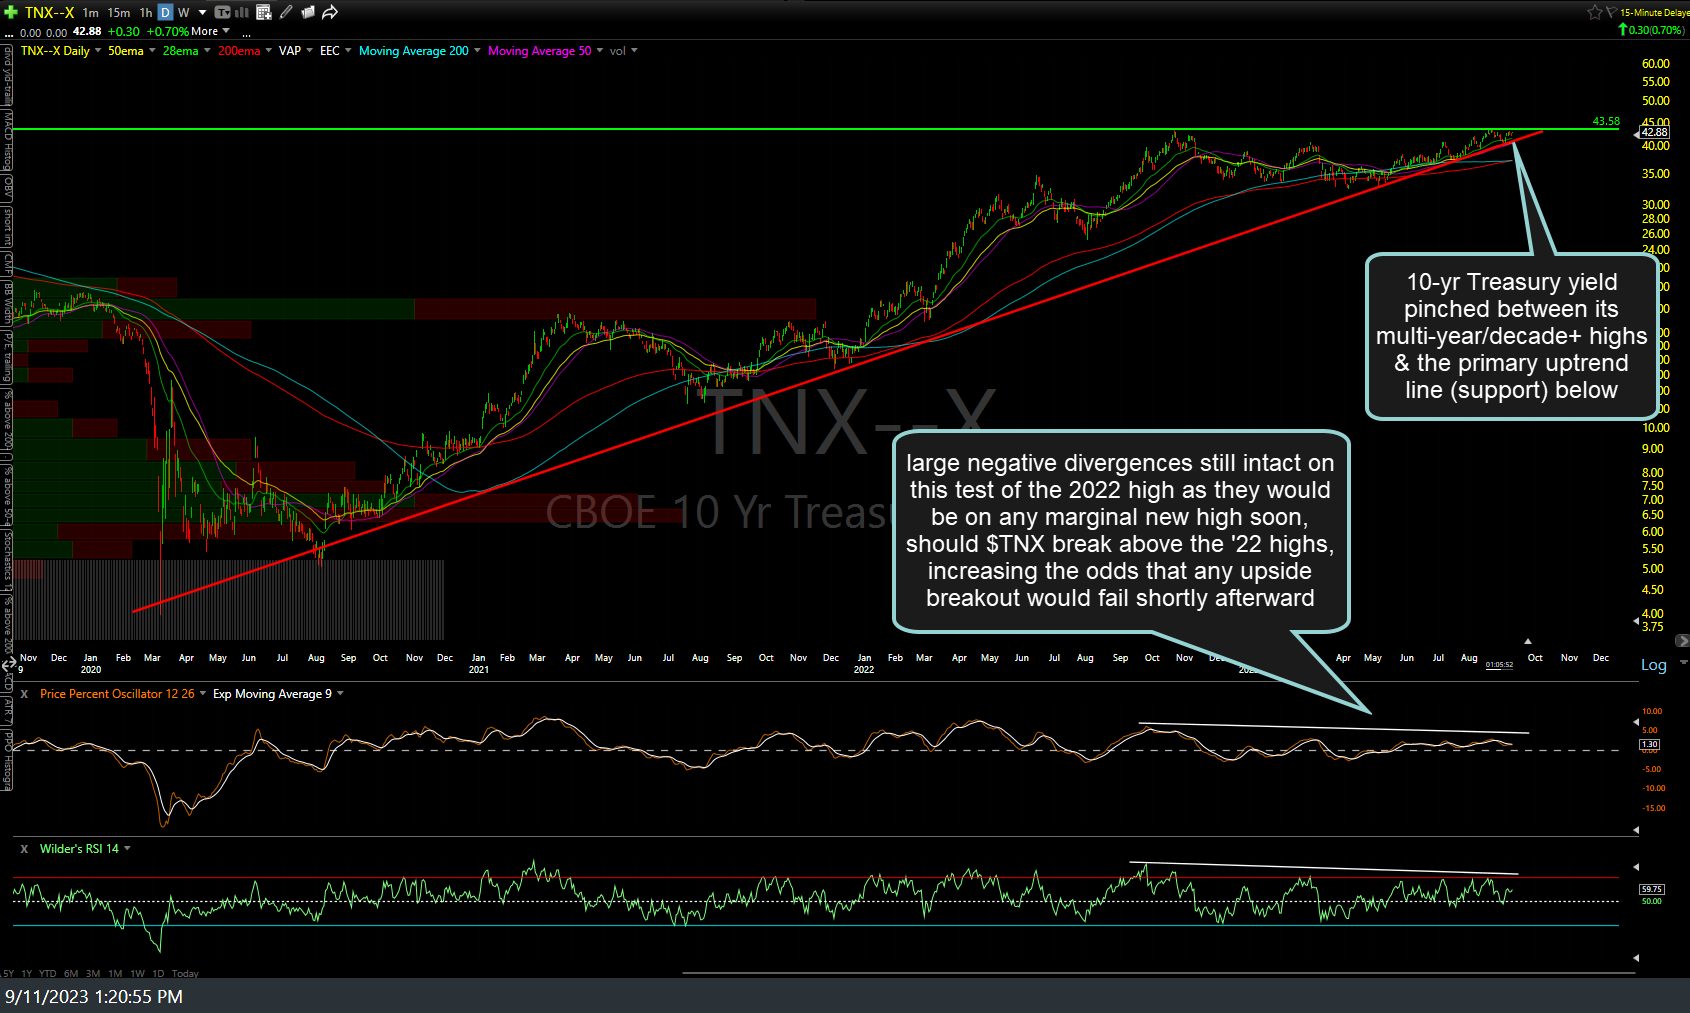
$TNX daily Sept 11th
BOTTOM LINE: Several key stocks (such as AAPL & JPM), key sectors (semiconductors), as well as the major stock indices are at or near key levels that have the potential to relatively quickly increase the odds of my primary (July 27th was the end of a bear market rally with the next major leg down underway) or my alternative (marginal new highs followed by major leg down) scenarios.
With long-term interest rates within spitting distance of breaking out to multi-year highs & commodity prices appearing to have resumed their bull market following what appears to be a 1-year counter-trend correction (from the 6/9/22 divergent high down to the 5/31/23 divergent low, which has since been followed by two recent breakouts above significant resistance levels), either the stock market is playing a game of chicken with the Fed & inflation/higher interest rates trade or it knows something that the bond & commodity markets just aren’t seeing at this time.
Should inflation/interest rates continue to rise, that will almost certainly pose a significant & ever-increasing headwind for the stock market & vice versa should longer-term interest rates begin to fall (*other than due to a flight-to-safety bid from institutional buying in the case of a strong stock market sell-off).