
QQQ remains in a near-term uptrend as it continues to work higher within the lower half of the price channel. The next sell signal may come on a break below the channel although QQQ is unlikely to make any big moves until Thurs or Fri after the big earnings reports from MSFT, AMZN & INTC.
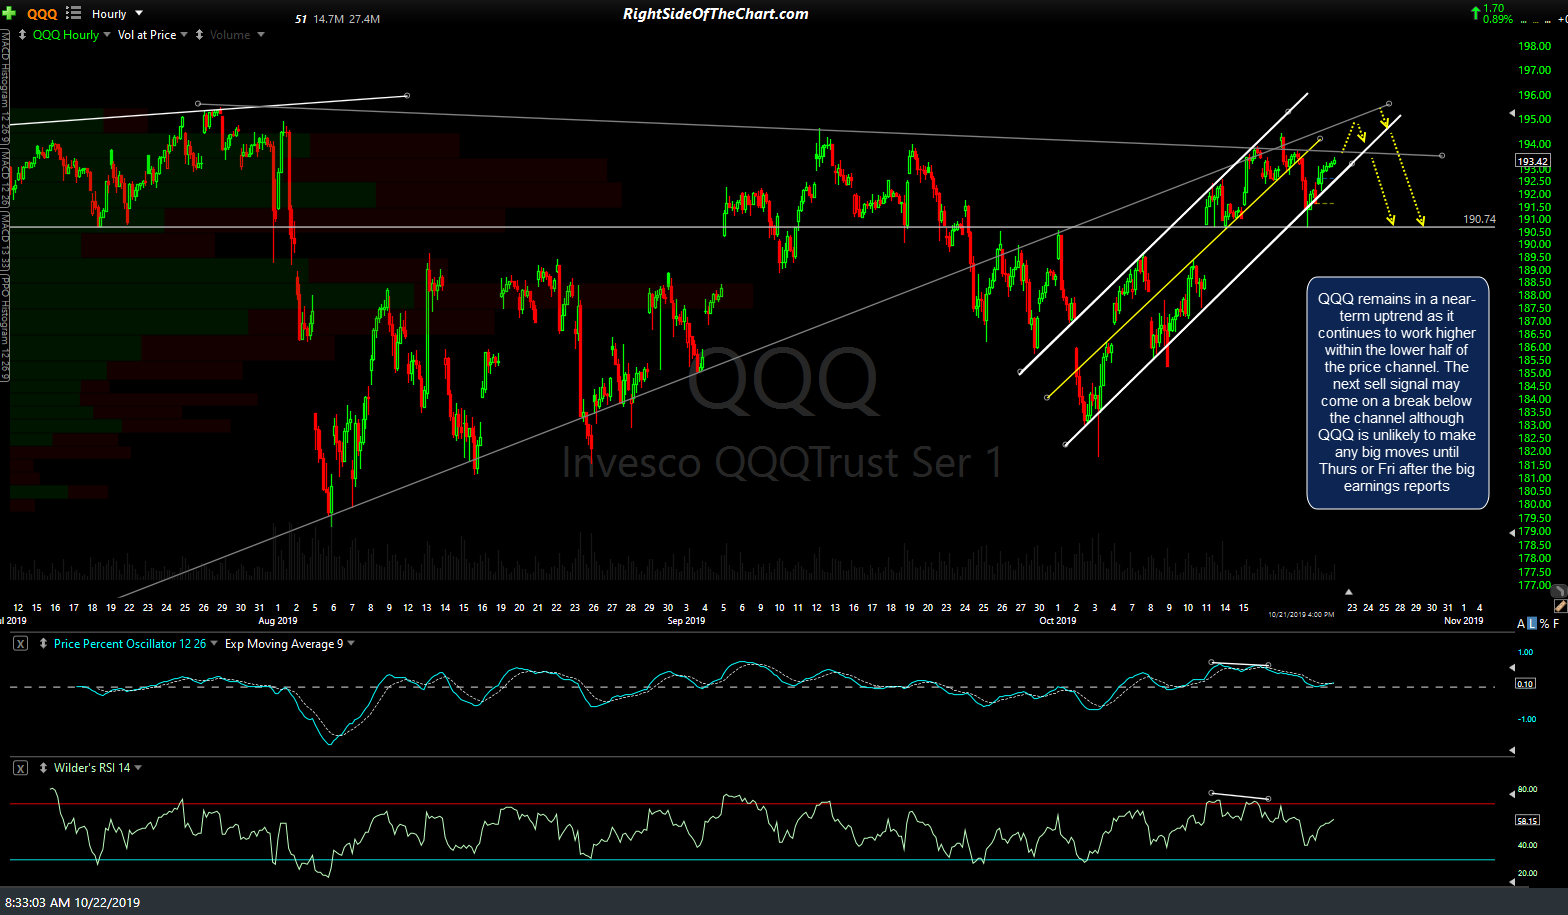
QQQ 60m Oct 22nd
Although I don’t foresee any large moves, up or down, in the $NDX before those big earnings reports are out of the way, there are 9 reasons on the 60-minute chart of /NQ below why I favor a pullback in /NQ today even though QQQ is currently poised to gap higher at the open today. The 4 circles up top highlight the failures at the 7980 resistance levels where the 5 circles on the RSI below show the tags of the extreme oversold 85 level, all of which were also followed by pullbacks/corrections.
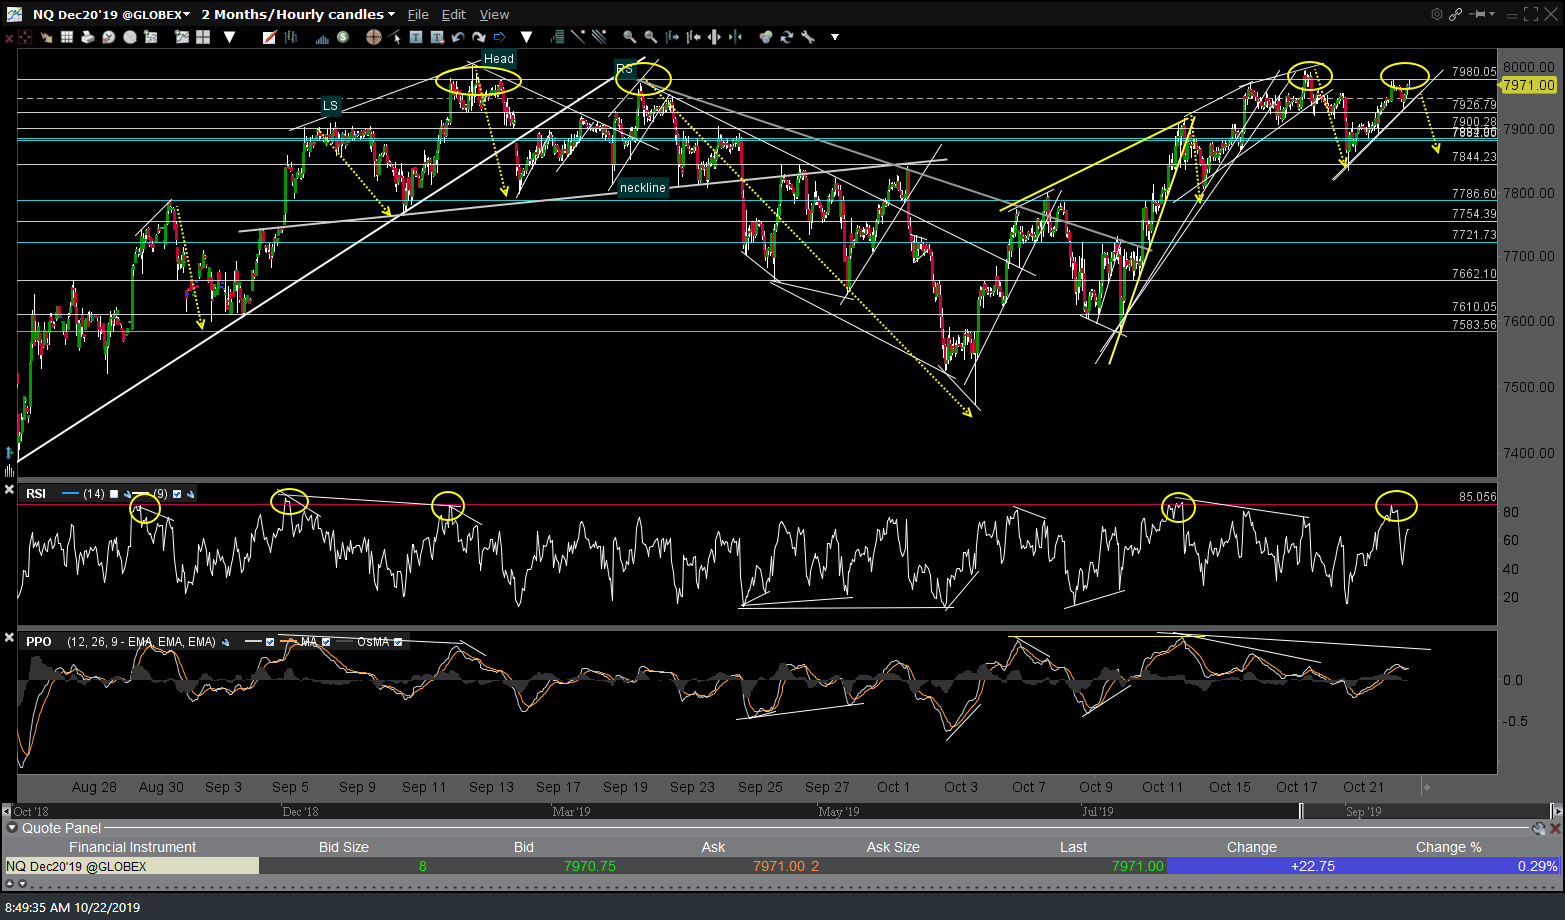
NQ 60m Oct 22nd
On a somewhat related note (as Treasury bonds tend to move inversely to the stock market), /ZB (30-yr T-bond futures) have broken out above minor downtrend line resistance following the recently highlighted divergent low on the 60-min chart with the next buy signal to come on a break above this second minor trendline.

ZB 60m Oct 22nd
Likewise, /ZN (10-yr T-bond futures) appears poised to rally on a break above both downtrend lines on this 60-minute chart.

ZN 60m Oct 22nd
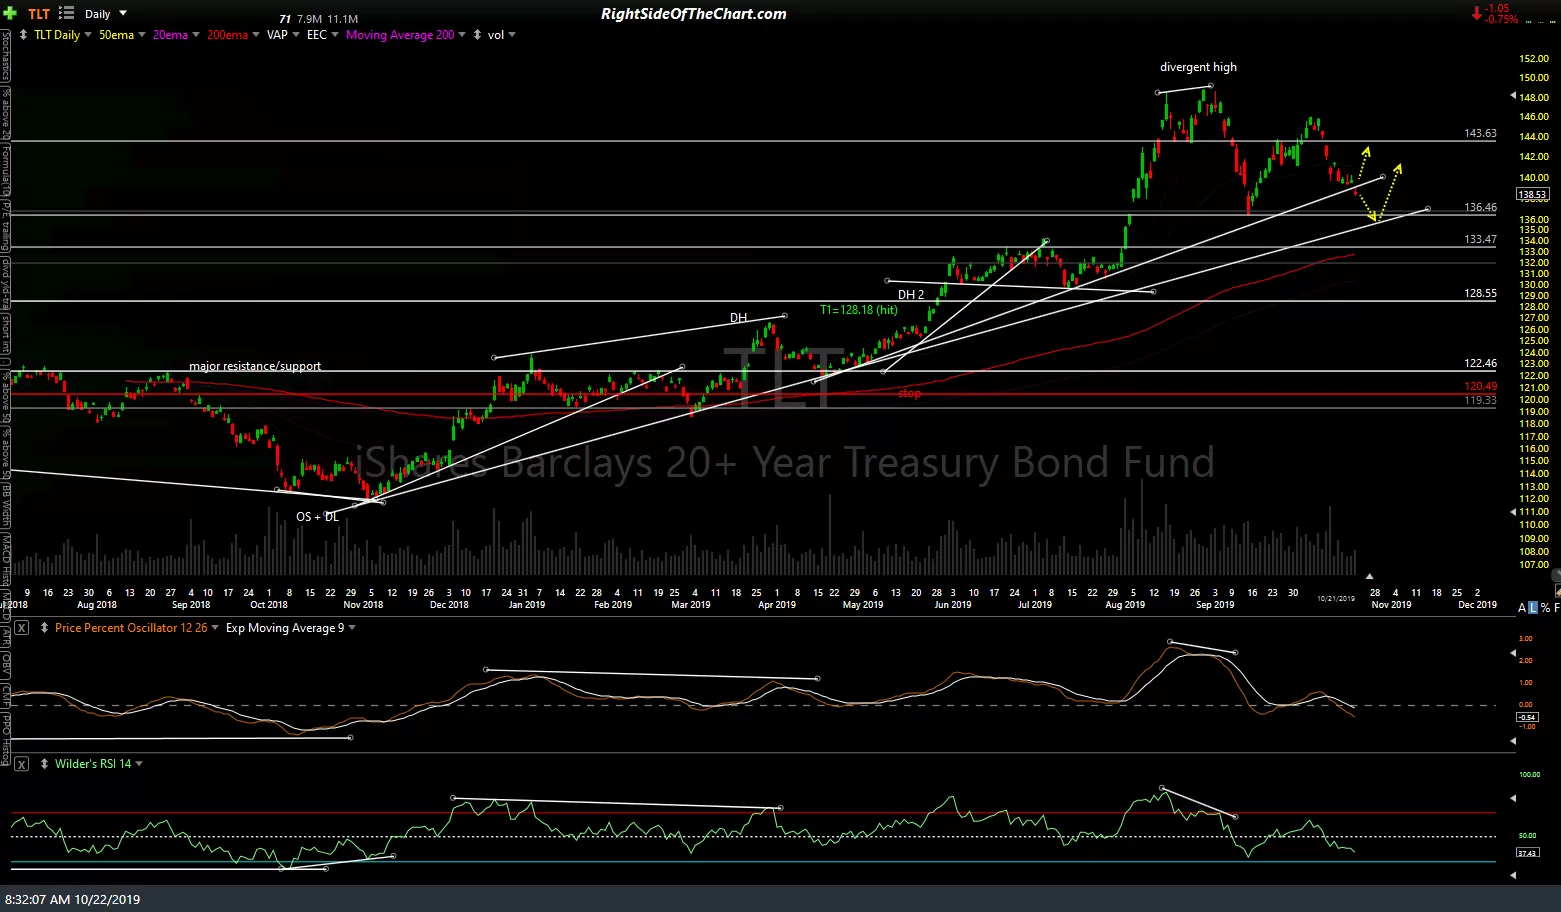
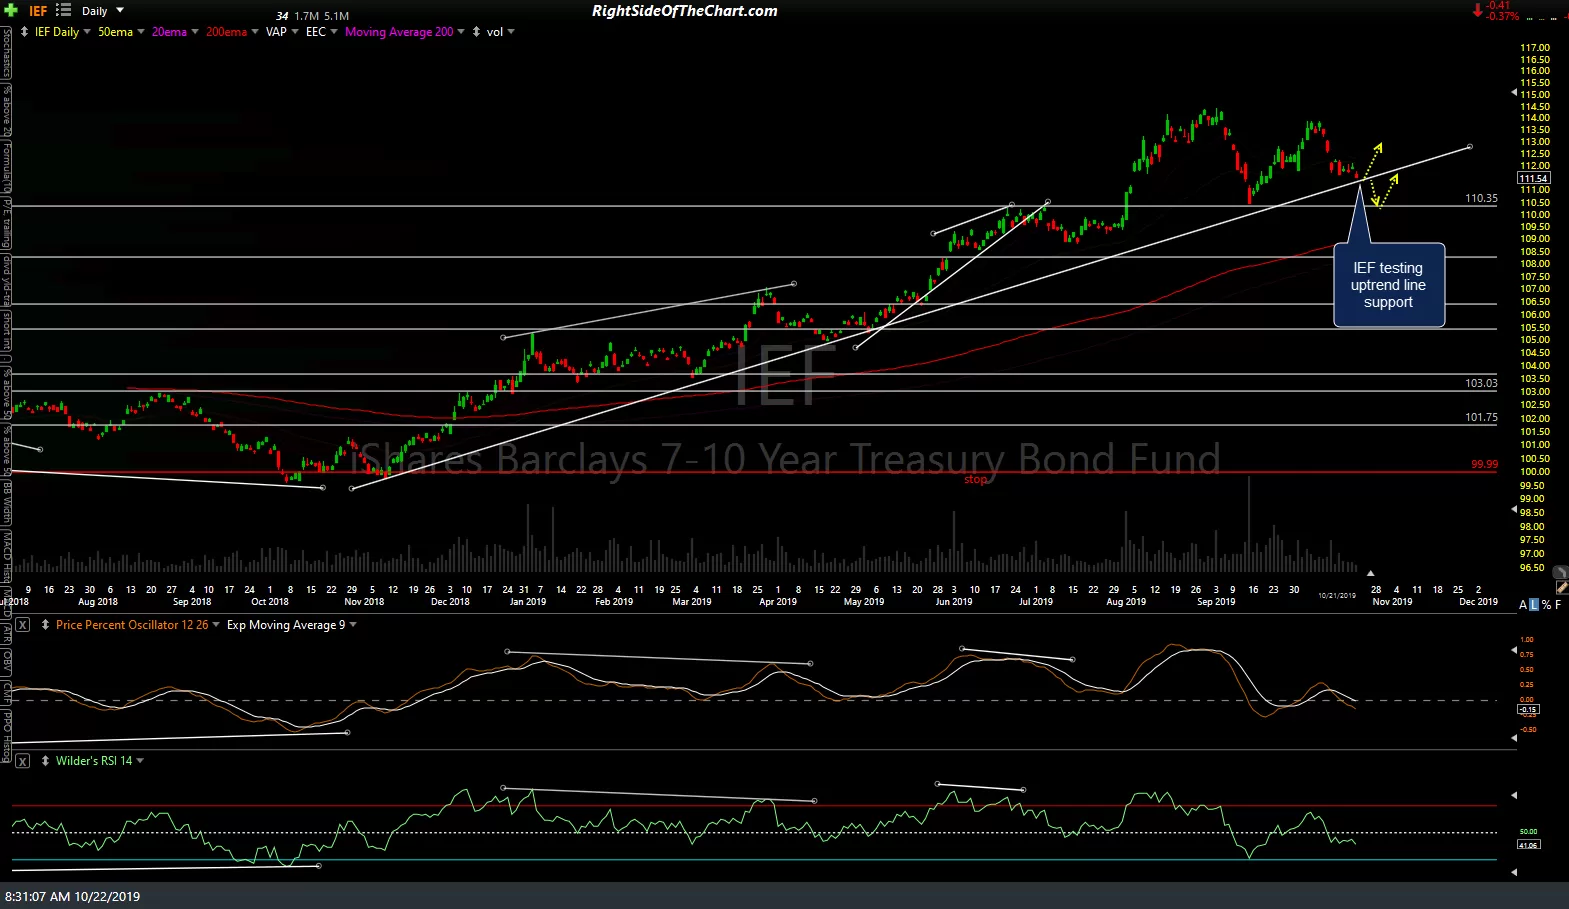
TLT (30-yr T-bond ETF) and IEF (10-yr T-Bond ETF) has also fallen to trendline support on these daily charts below with decent support not far below should those TL’s go.
-
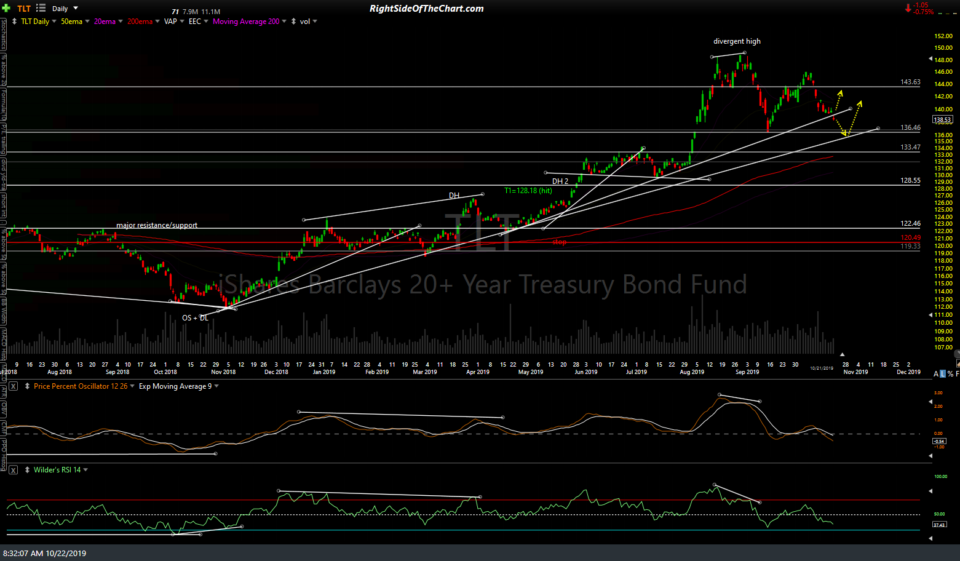
- TLT daily Oct 22nd
-
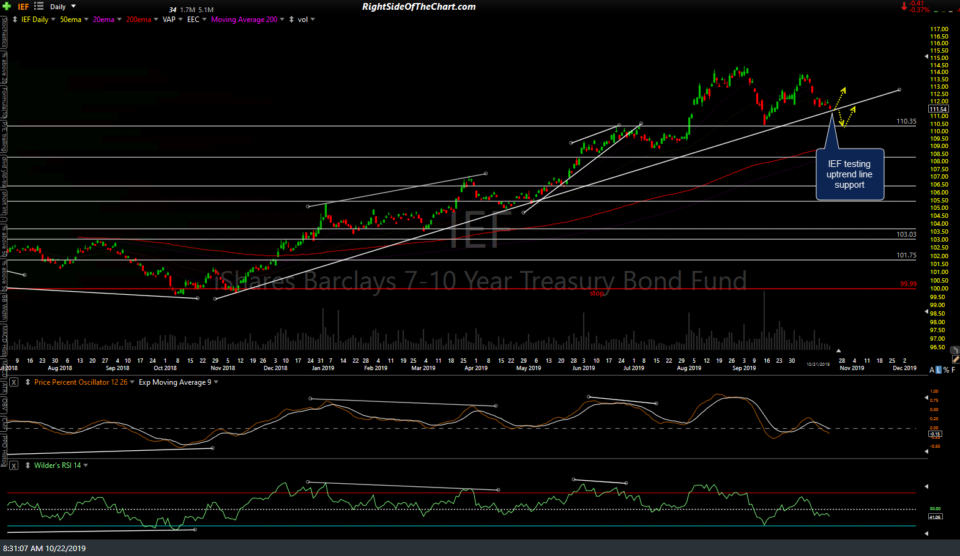
- IEF daily Oct 22nd
LIT (Lithium ETF) is still on watch for a break above the minor & primary downtrend lines. LIT, as well as numerous individual lithium stocks that are setting up in potentially bullish technical postures, were recently highlighted in this video on Sept 20th.
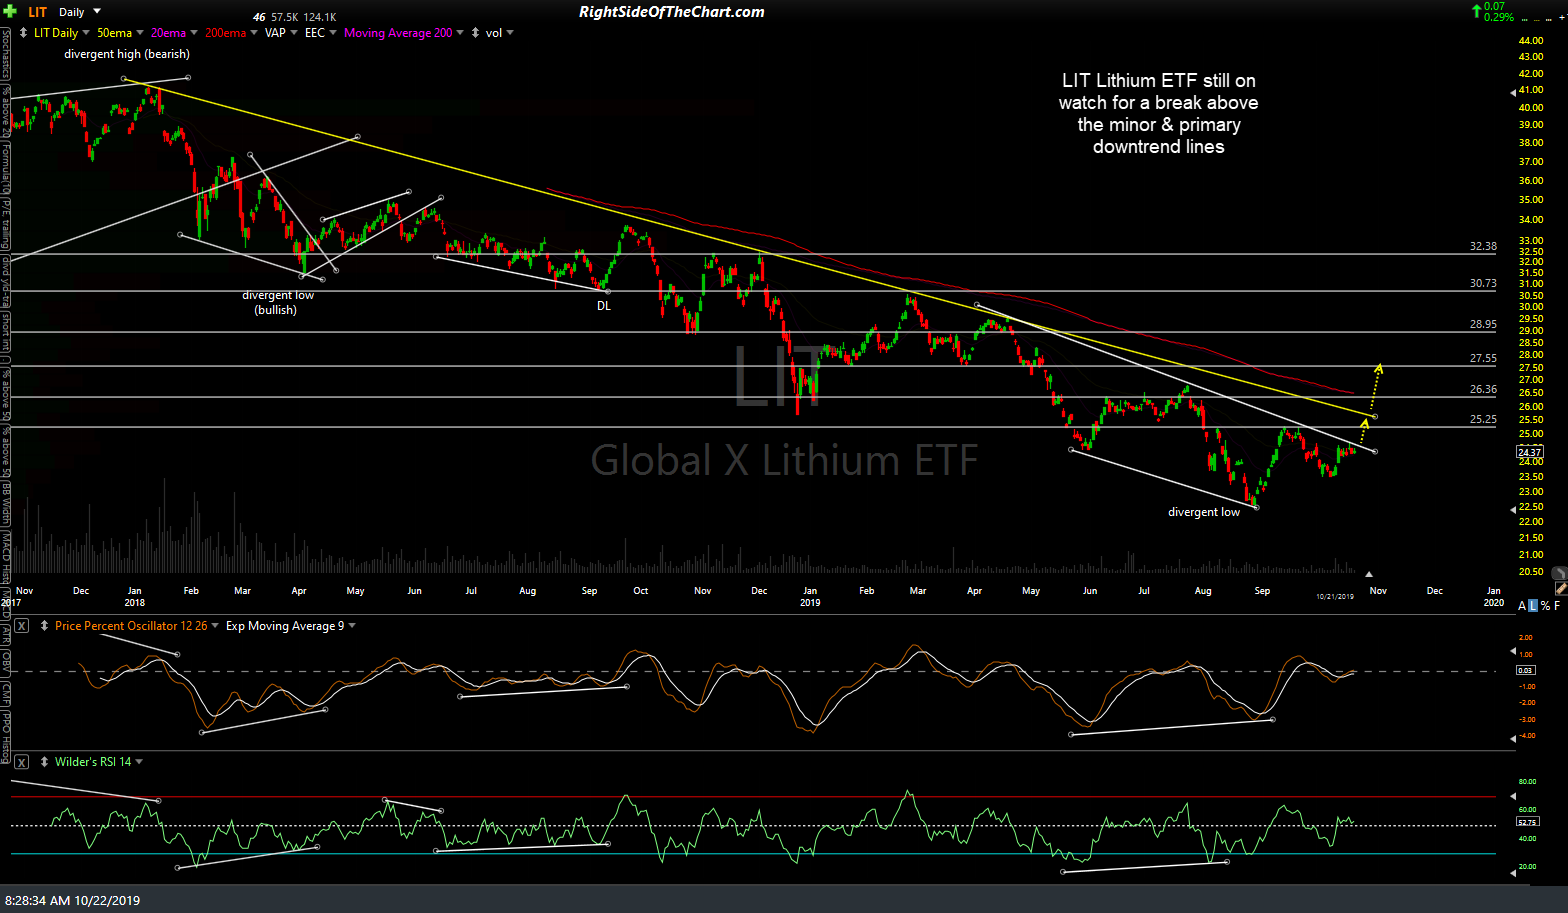
LIT daily Oct 22nd
FYI- I have a few more charts that I was going to post but I just lost power & my UPS battery backup will only run my trading PC & 4 monitors for a short while so I’m going to fire off this post now & will follow up with the others when my power is restored.