
I’ve been monitoring some recent developments where both /ES & /NQ (S&P 500 and Nasdaq 100 futures) are setting up in what appears to be bullish falling wedge patterns on the 60-minute time frames. The fact that these wedge patterns have positive divergence with prices making lower lows & the momentum indicators making higher lows, indicates that a breakout above the wedges (downtrend lines) on both /ES & /NQ could spark a rally up to some of the nearby overhead resistance levels on these charts.
-
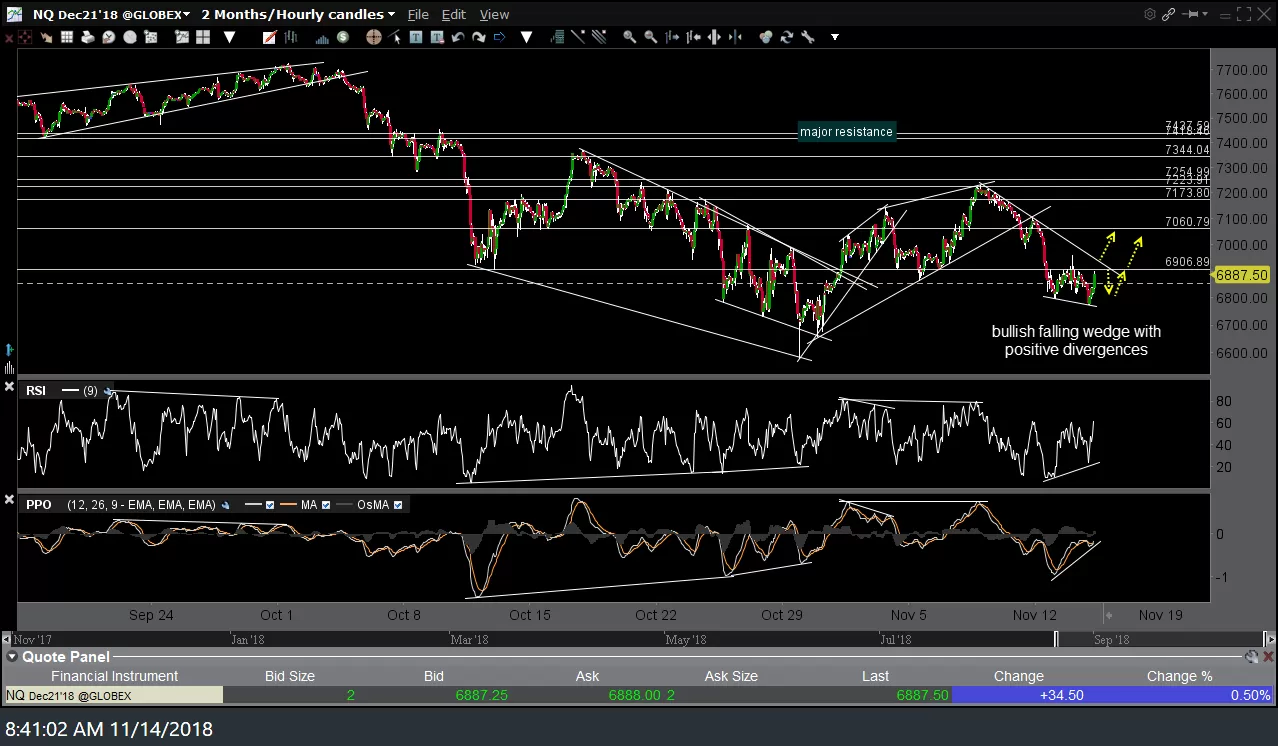
- NQ 60-min Nov 14th
-
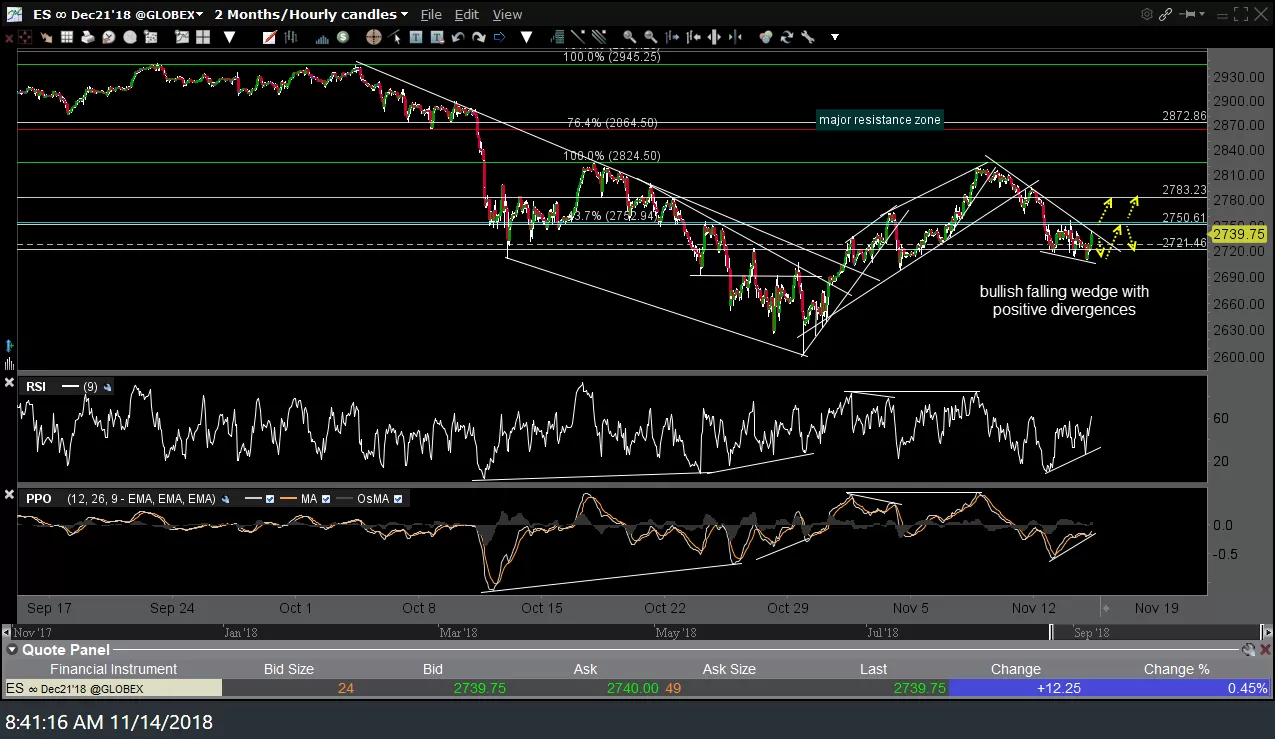
- ES 60-min Nov 14th
As much as I would like to be here to watch how these patterns resolve leading up to & after the stock market opens today, I have a 10:00 dentist appointment that will keep me away from my desk until at least 11:30 am EST today. As such, I will post an update on the markets as soon as I return. Until then, it would seem prudent to hold off on adding any new short exposure until we see if we get a convincing breakout of these patterns, which would also align with the 60-minute bullish divergences on this swing trade setup that I posted on AAPL (Apple Inc.) in the trading room yesterday (link requires Gold access to view). Active traders might opt to position long on a breakout (both NQ & ES) or possibly on one more thrust back down within the wedges, assuming that the charts are still constructive at that time.