
Another Groundhog Day as the summer doldrums kick in: Still awaiting a break below S1 to spark an impulsive sell-off in /NQ (& QQQ), although a nearly horizontal wedge has since formed as the divergences continue to build with a break below it likely to be the catalyst for the next drop to S1. Previous (June 3rd) and updated 60-minute charts of /NQ (Nasdaq 100 futures) below.

NQ 60m June 3rd

NQ 60m June 10th
Ditto for the $VIX (VIX volatility index) which is now coming up on that 16.15 support level that the dotted arrows had it dropping to before rallying in the last update posted on May 30th (first 120-minute chart below).

$VIX 120m May 30th
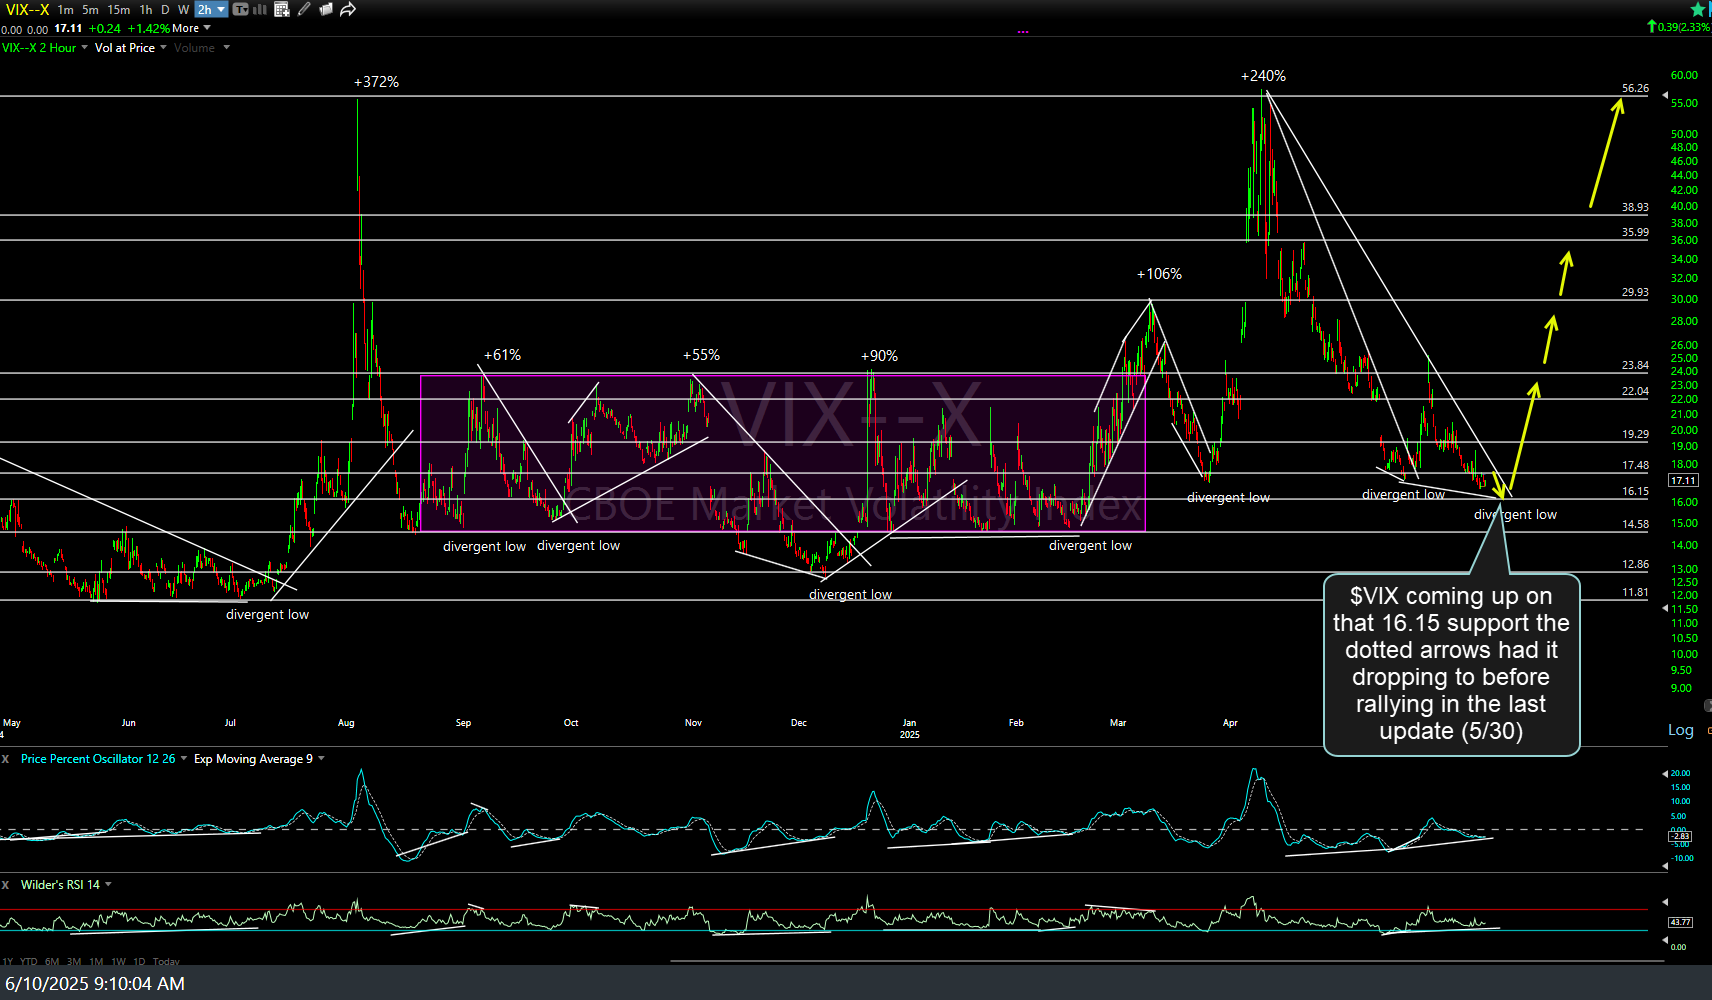
$VIX 120m June 30th
QQQ continues to wedge higher following the pre-market hit & bounce off T1 back on May 23rd (first 60-minute chart below) with the next sell signal still to come on a solid break and/or close below this secondary trendline.
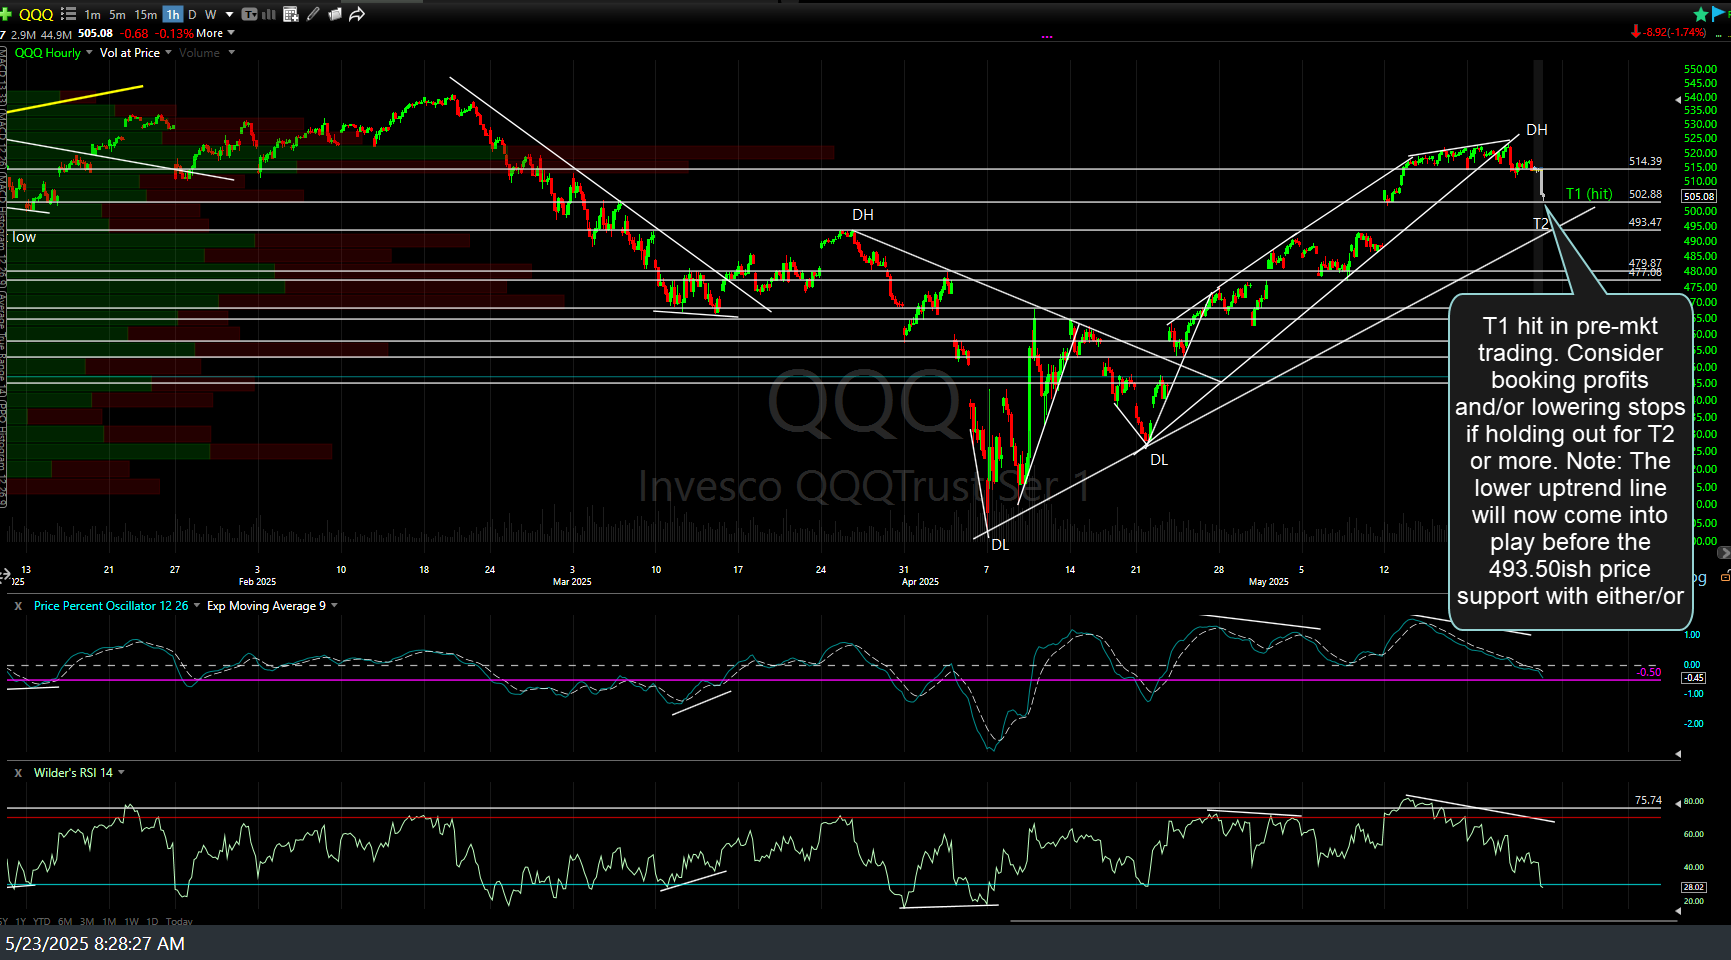
QQQ 60m May 23rd

QQQ 60m June 10th
SPY (S&P 500 ETF) is backtesting the recently broken secondary uptrend line while it continues to wedge higher, extending the divergences & awaiting a comparable trendline break on QQQ. 60-minute chart below.

SPY 60m June 10th
“Trading is a waiting game. You wait and wait and wait. Then you get in. Then you wait and wait and wait some more.”
– Jesse Livermore