
We have a slew of market & industry-leading stocks reporting earnings today, some of which appear to be setting up as potential swing or trend trading opportunities. One company worth watching today is BA (Boeing), which has already reported before the opening bell today. BA has been all over the place in the pre-market session so far, dropping as low as 369 & running as high as 381 (as I type). As with any stock reporting earnings, best not to read too much into the initial knee-jerk reaction(s), rather wait until the conference call is over as well waiting to see how the stock trades once the starters (institutions) step onto the playing field after the 9:30 am opening bell.
BA is smack in the middle of this large rising wedge pattern (white lines) as well as the megaphone pattern (yellow TL + the upper white divergence line) on this weekly chart. A major sell signal would come on a weekly close below the uptrend line although that could come soon or months from now if BA continues to work its way higher within the wedge pattern. For the time being, I plan to sit back & watch this one to see how the stock as well as the broad market & even the aerospace & defense sector trade before revisting BA as another potential trading opp.
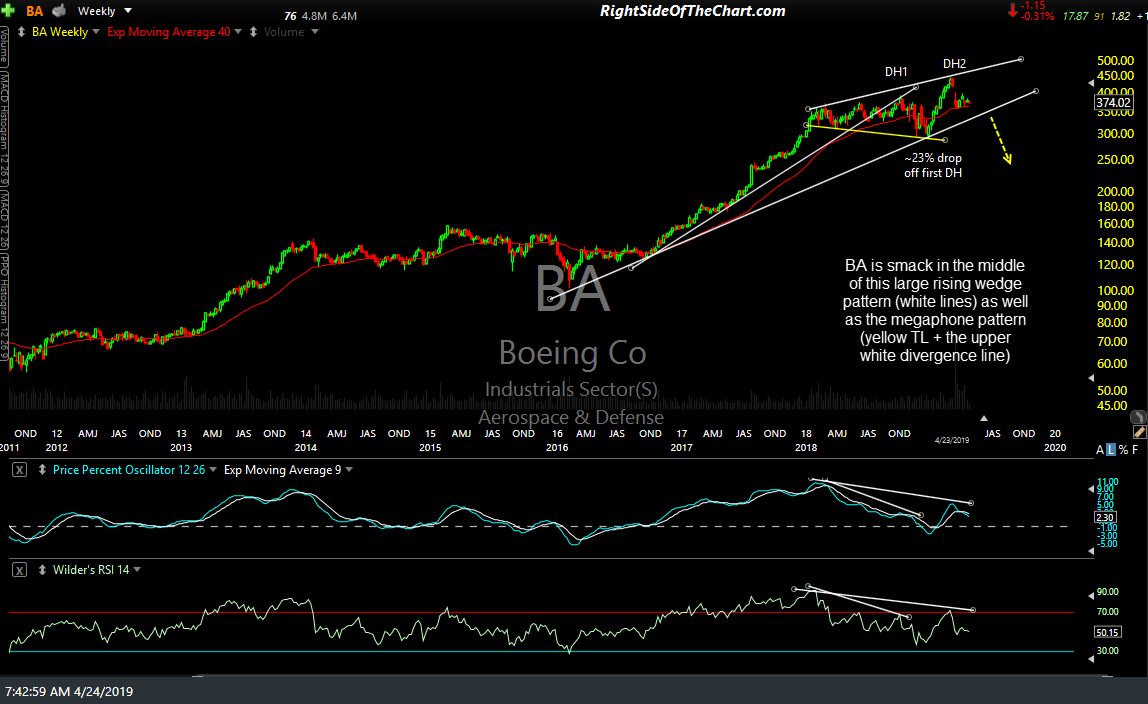
BA weekly April 23rd close
The market will likely grind around in a holding pattern today, awaiting cues from the 2 of the 5 FAAMG stocks that report after the close today, FB (Facebook) & MSFT (Microsoft), as well as some other popular stocks such as V (Visa), TSLA (Tesla) PYPL (PayPal). TSLA is precariously perched at the bottom of this 2.4 year trading range with today’s earnings report likely to either spark the next rally back to the top of the range or a break below it. A solid weekly close below would most likely be the catalyst for a move down to the bottom of the 2014-2017 trading range (weekly chart):
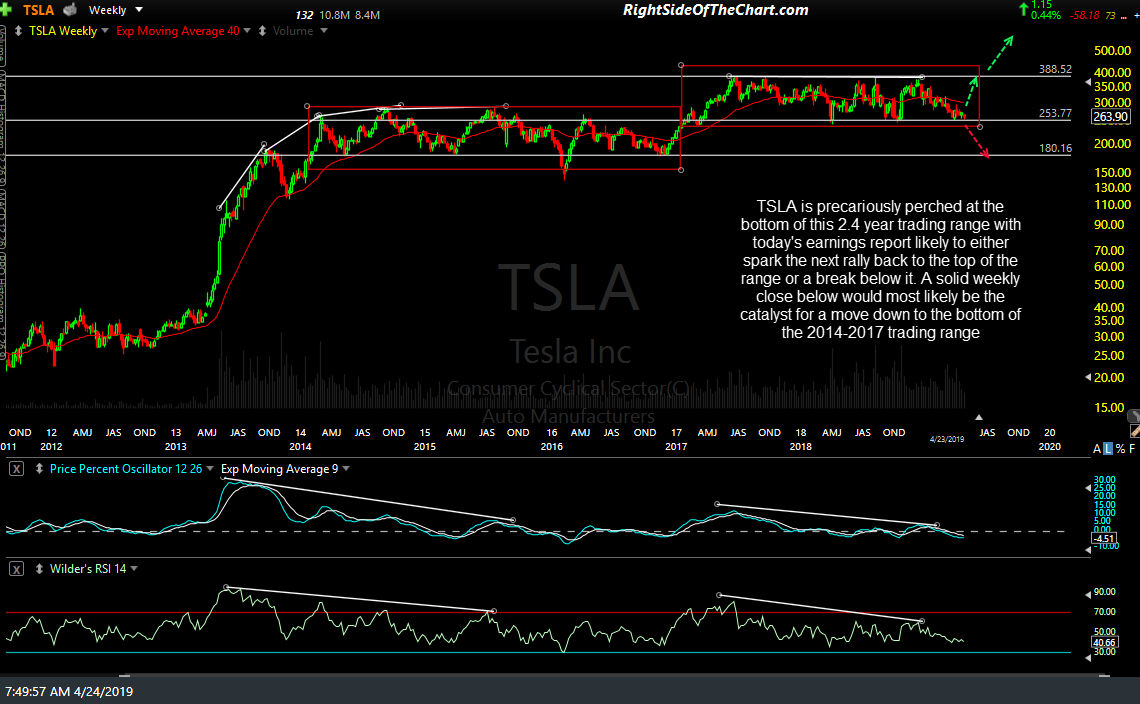
TSLA weekly April 23rd close
On the weekly (first) chart below, the divergences that were in place leading up to the ~20% drop in V last year are still very much intact and continue to build, although this is only ‘potential’ divergence, with confirmation pending a bearish crossover on the weekly PPO at or below the previous reaction high.
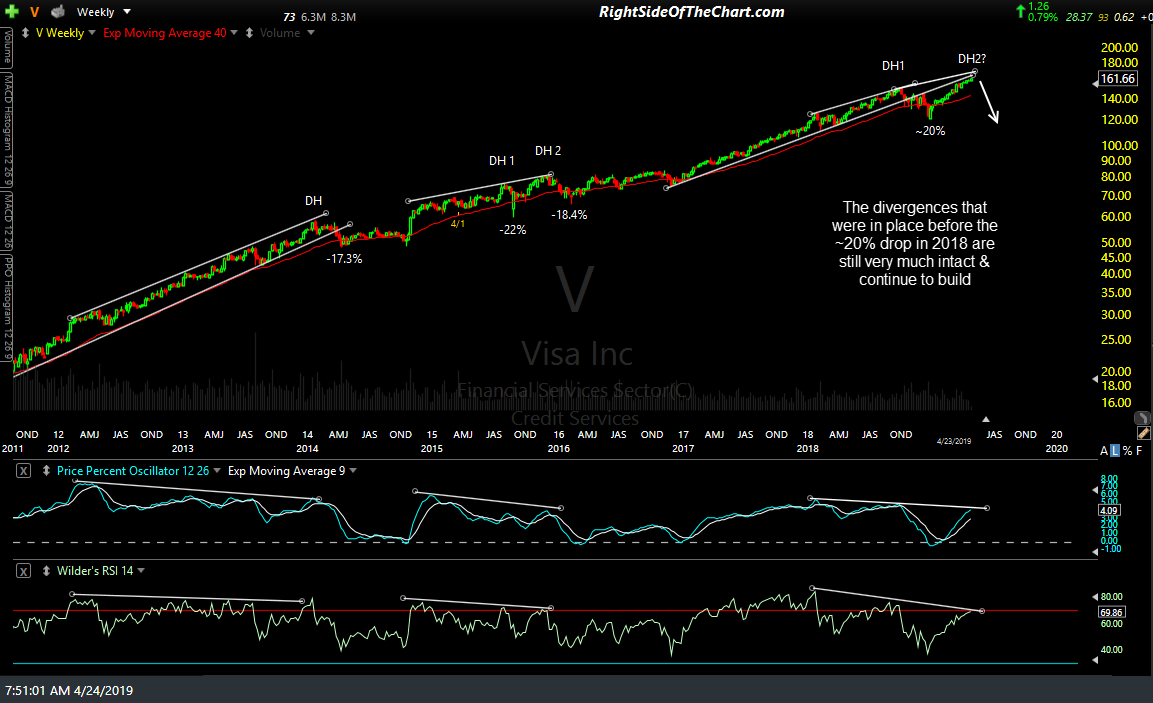
V weekly April 23rd close
Zooming down to the daily time frame, As back in 2018, I am awaiting a solid break and/or daily close below this uptrend line for a sell signal on Visa with a minimum swing target of 144.72.

V daily April 23rd close
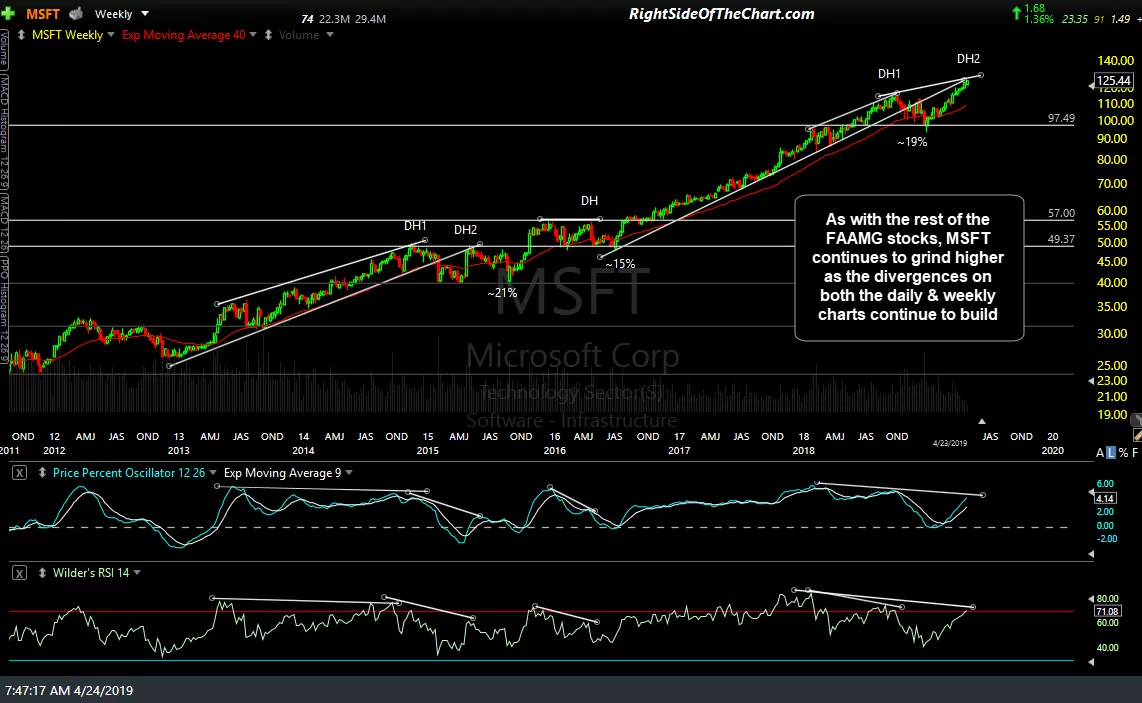
As with the rest of the FAAMG stocks, MSFT continues to grind higher as the divergences on both the daily & weekly charts continue to build. Awaiting a solid break & close below the daily uptrend line for the next sell signal on MSFT, ideally with confirmation via a break below the comparable uptrend lines on both QQQ & XLK (tech sector ETF).
-

- MSFT weekly April 23rd close
-
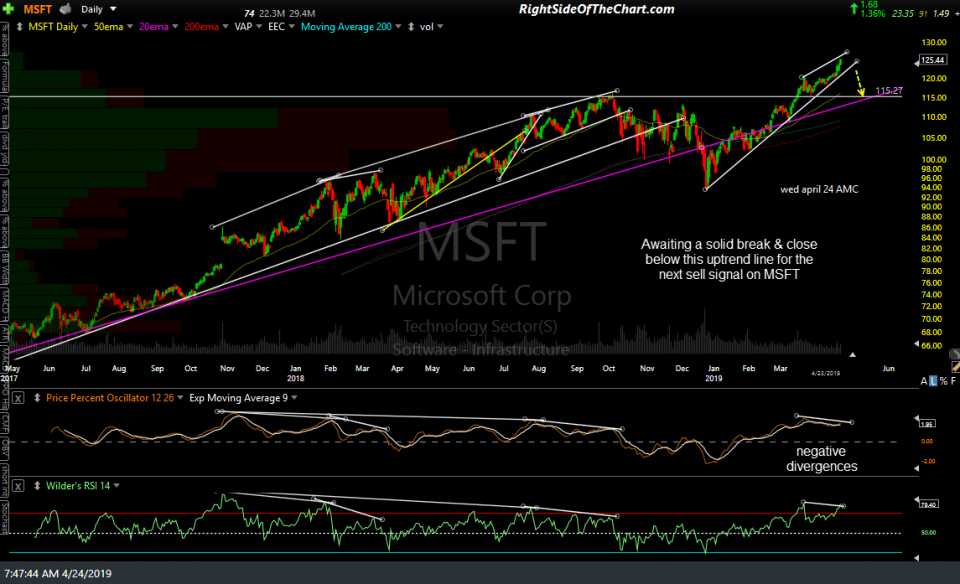
- MSFT daily April 23rd close
