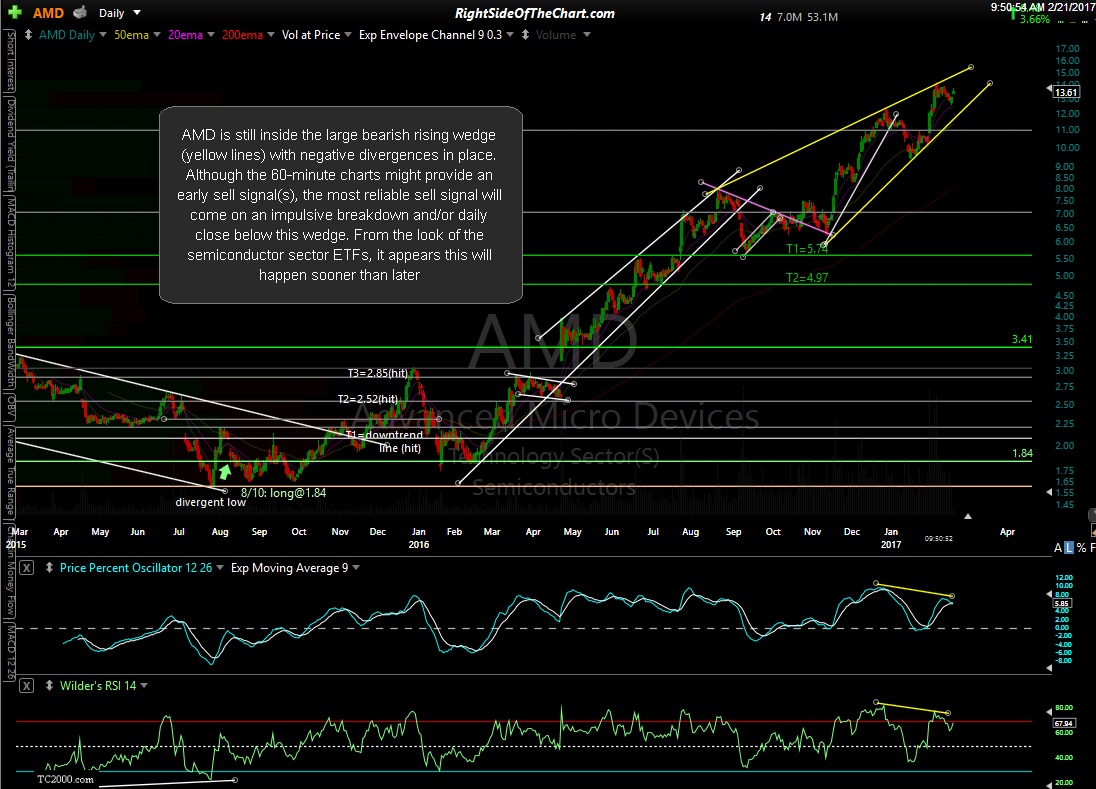
Member @gonewiththewind requested an update on AMD (Advanced Micro Devices) within the trading room. As there has been a lot of interest in AMD in recent months, I figured that I’d post my thoughts on this runaway freight train semiconductor stock for those that are also following it. AMD is still inside the large bearish rising wedge (yellow lines) with negative divergences in place as shown on this daily chart below. Although the 60-minute charts might provide an early sell signal(s), the most reliable sell signal will come on an impulsive breakdown and/or daily close below this wedge. From the look of the semiconductor sector ETFs, it appears this will happen sooner than later.
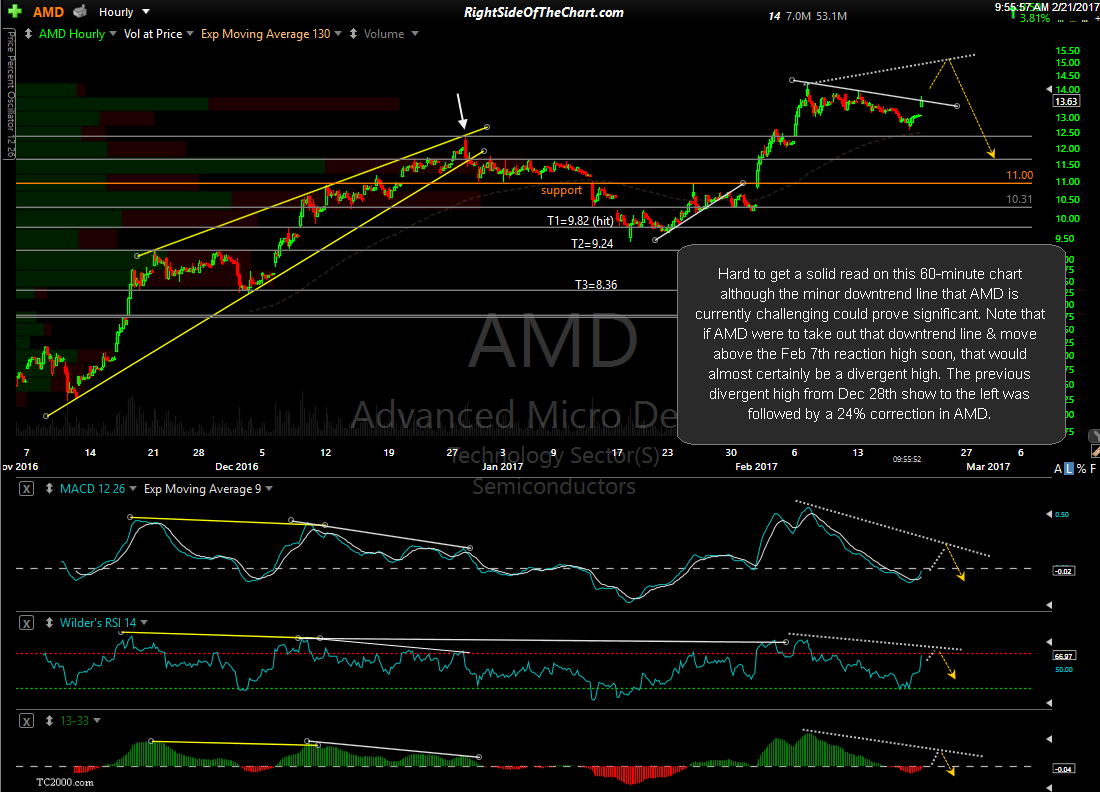
While it’s hard to get a solid read on this 60-minute chart although the minor downtrend line that AMD is currently challenging could prove significant. Note that if AMD were to take out that downtrend line & move above the Feb 7th reaction high soon, that would almost certainly be a divergent high. The previous divergent high from Dec 28th show to the left was followed by a 24% correction in AMD.
Essentially, one needs to keep a close eye on the semiconductor sector ETFs (SMH, XSD & SOXX) to watch for a breakdown below their respective uptrend lines in order to help confirm a sell signal on AMD. Such confirmation could help provide a timely exit for those already long AMD or any other semiconductor stocks as well as a short entry for a swing trade that could very easily last for several weeks to months & provide returns well into the double digits. Until then, the trend remains bullish although the clearly appear to be warning of an impending trend reversal at this time.


