
There has been some recent interest in ALK (Alaska Air Group Inc.) as well as crude oil within the trading room so I figured that I’d share my analysis on both here, as fuel prices are the second largest expense (behind labor) for airlines.
The first chart below is a daily chart of ALK overlaid with USO in white. In order to mitigate the impact of rising oil prices on their bottom line, airlines will attempt to hedge against rising oil prices & (ideally) remove hedges when they expect fuel prices to fall. It appears that ALK started to get their fuel hedging all wrong following this point, just before crude oil started its 75%+ bull run in June ’17 while ALK fell ~40% from its July 2016 high.
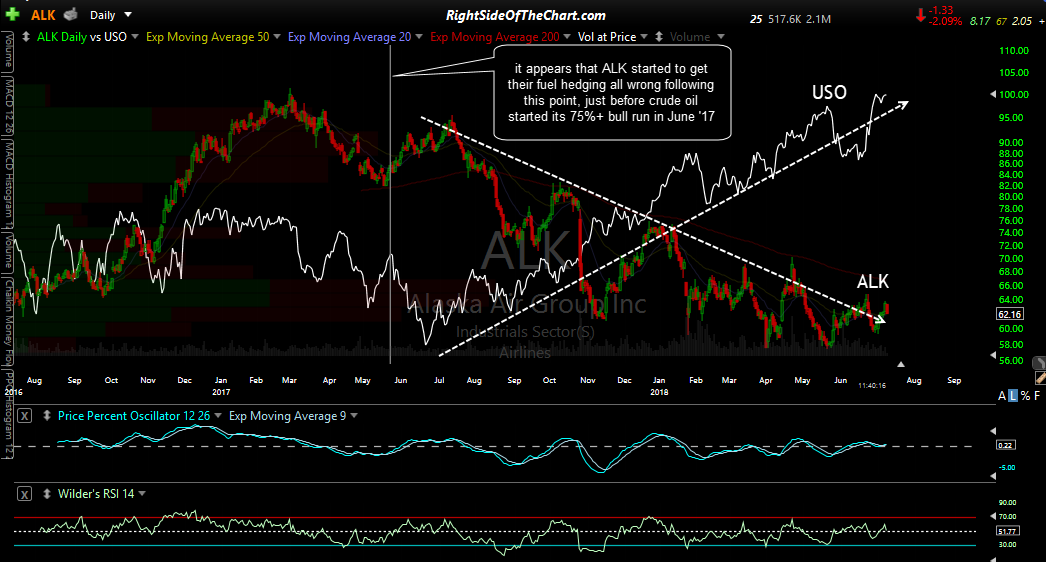
ALK vs USO daily July 10th
ALK continues to find support at the 58.40ish level which was first identified as a price target back in January 2016 when Alaska Air was poised to break down below its primary uptrend line (weekly chart). Zooming down to the daily chart, it appears that an impulsive breakout above this downtrend line & the 65 resistance level could spark a rally up to the 67.60 & 70.20 levels, possibly beyond.
-
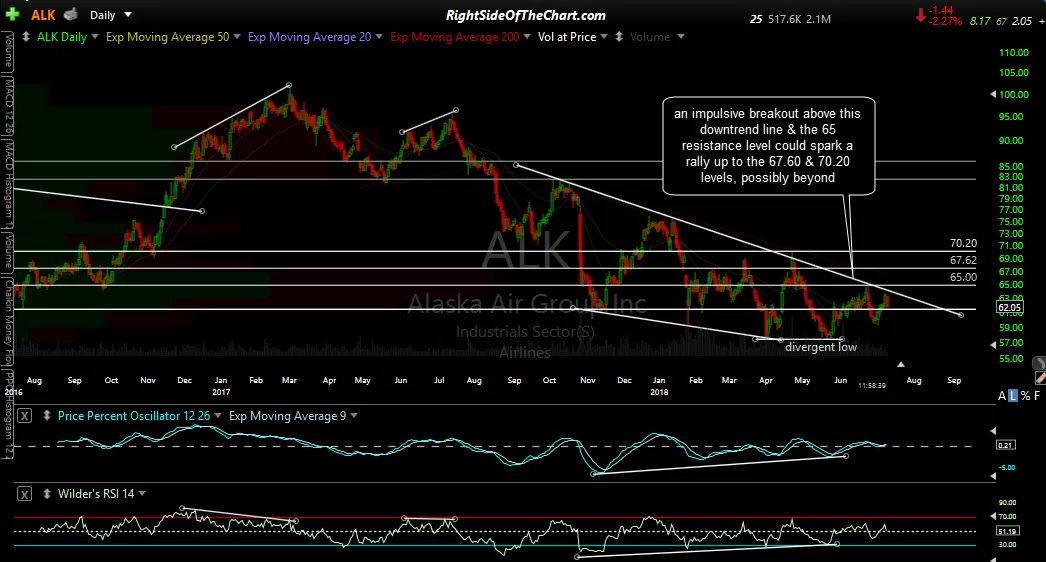
- ALK daily July 10th
-
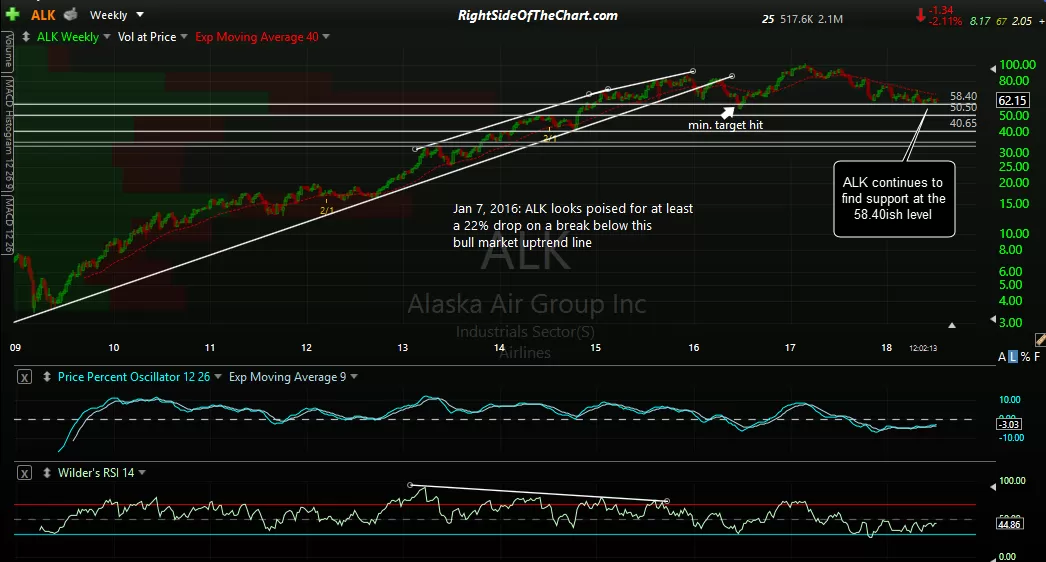
- ALK weekly July 10th
Likewise, I’m waiting some evidence of a reversal as well as confirmation of the current potential divergent high for a potential swing short entry on USO/crude oil. Daily chart below:
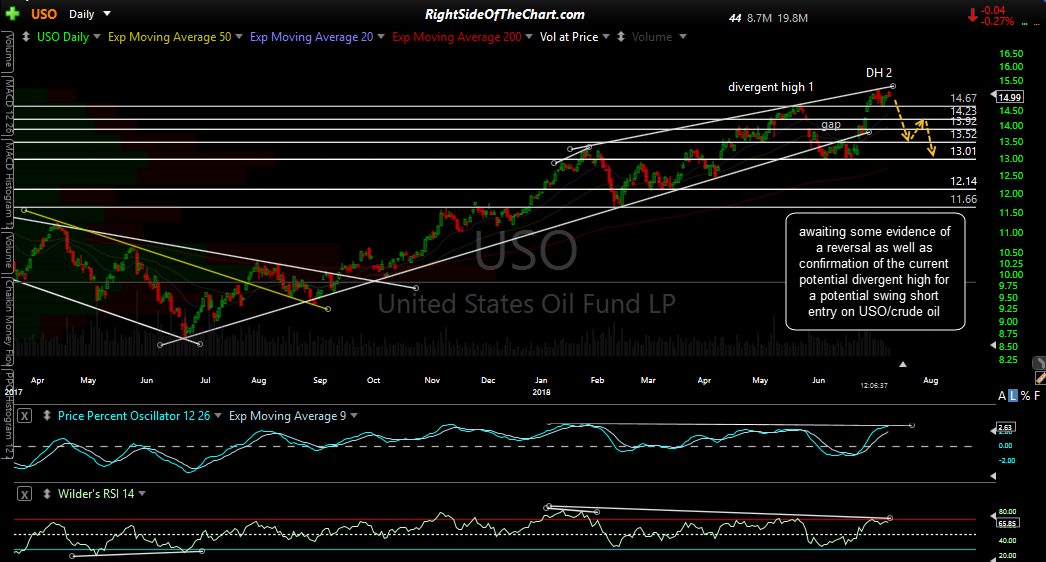
USO daily July 10th