The 60-minute charts of the major stock index ETF & futures highlight some key near-term levels & developments to watch for today & later this week. The next sell signal on QQQ to come on a solid break and/or close below the 211.42 support. Also, keep an eye on the PPO signal line for a solid cross down below the zero line as that would indicate the near-term trend has likely shifted from bullish to bearish.

QQQ 60m Jan 6th
The next sell signal on SPY to come on a solid break and/or close below the 319.48 support which will likely have triggered a bearish cross below the zero line on the PPO signal line (9-ema).
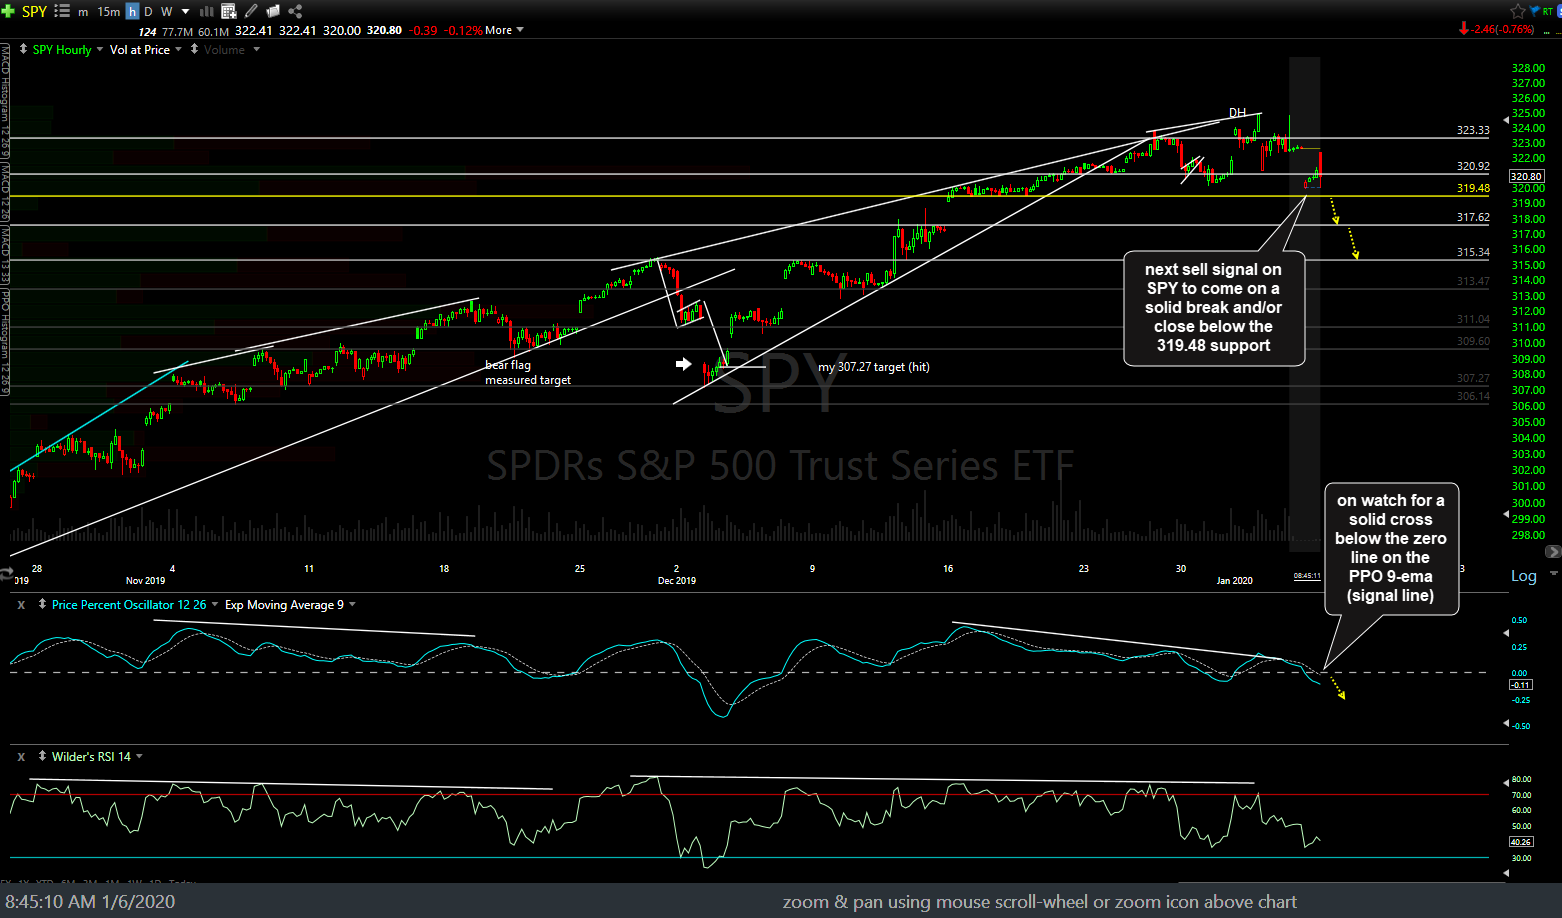
SPY 60m Jan 6th
I’m still awaiting a solid break below the 60-minute price channel in AAPL (Apple Inc.) for an additional sell signal on the major stock indices. As of 9:00 am EST, AAPL is currently testing the bottom of the channel.
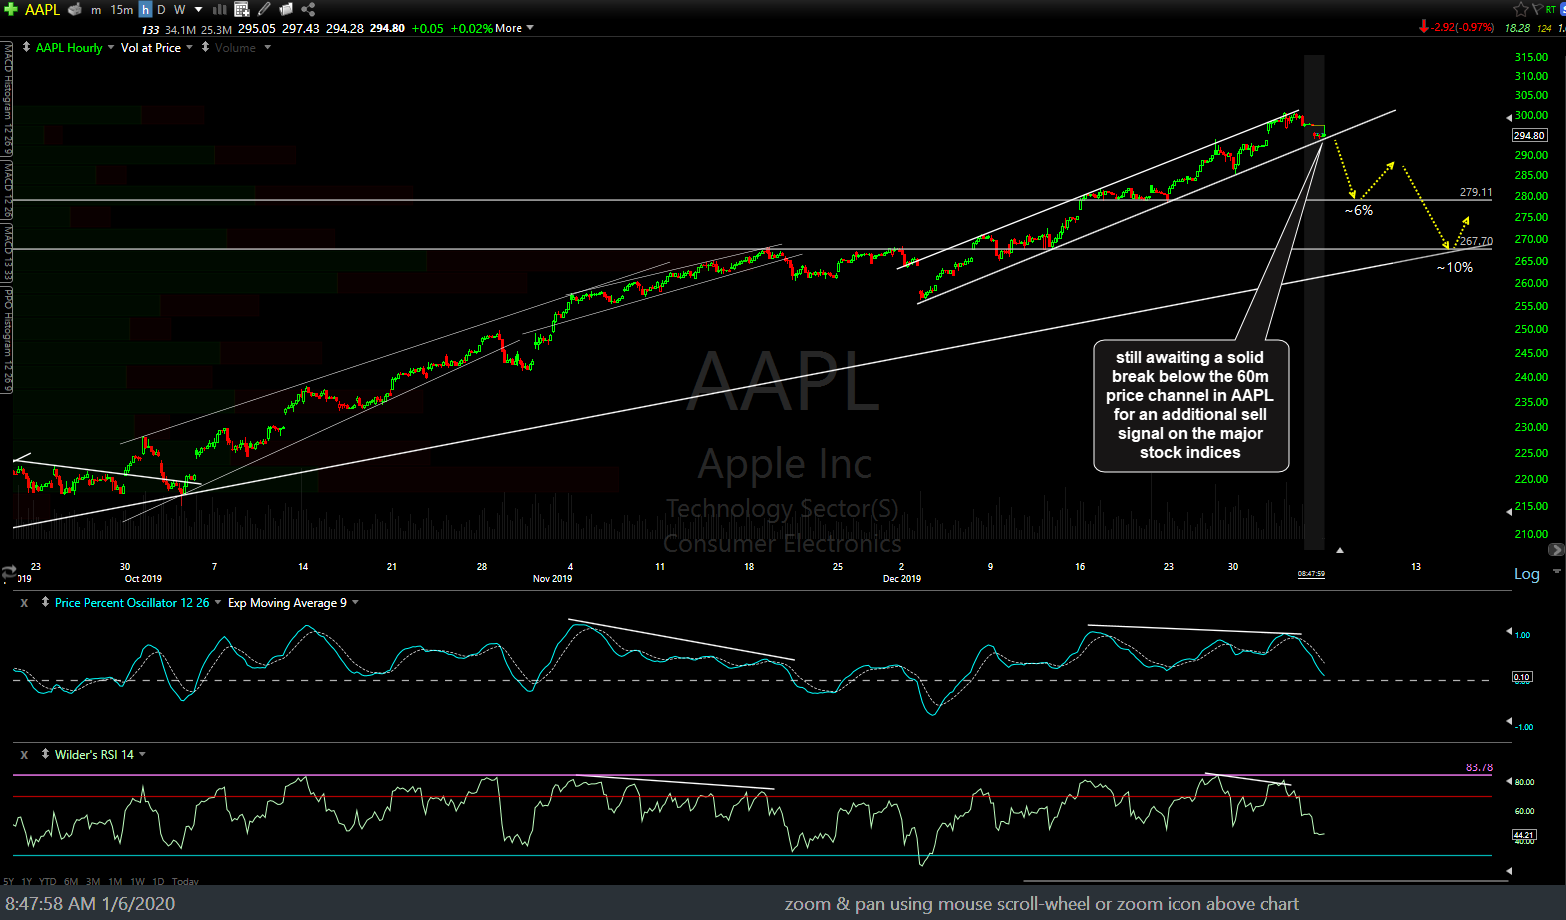
AAPL 60m Jan 6th
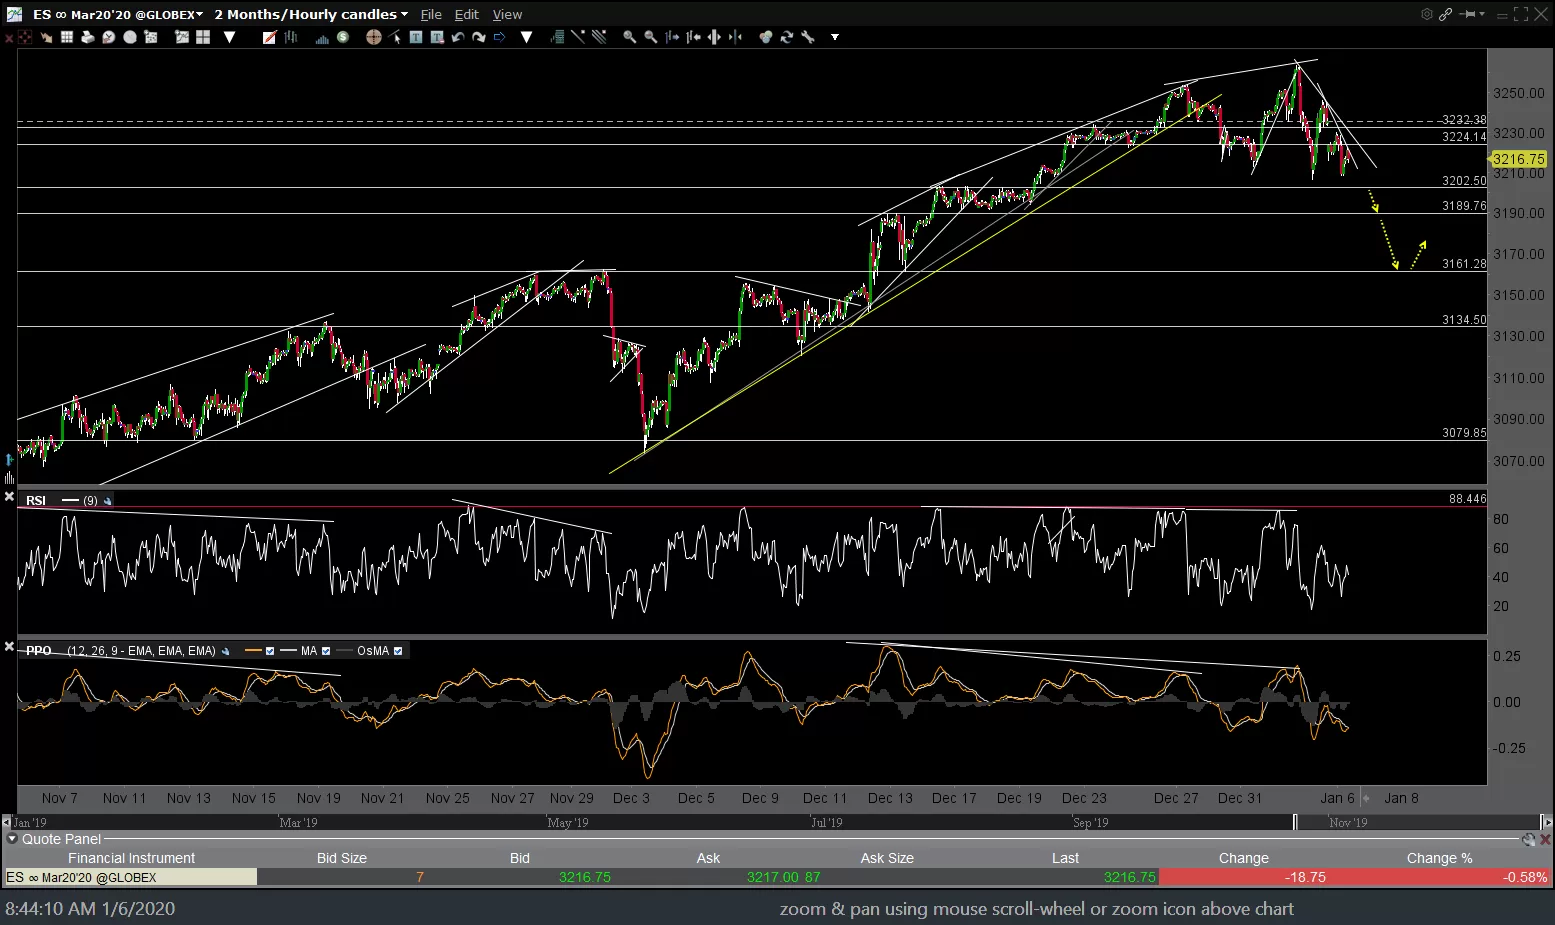
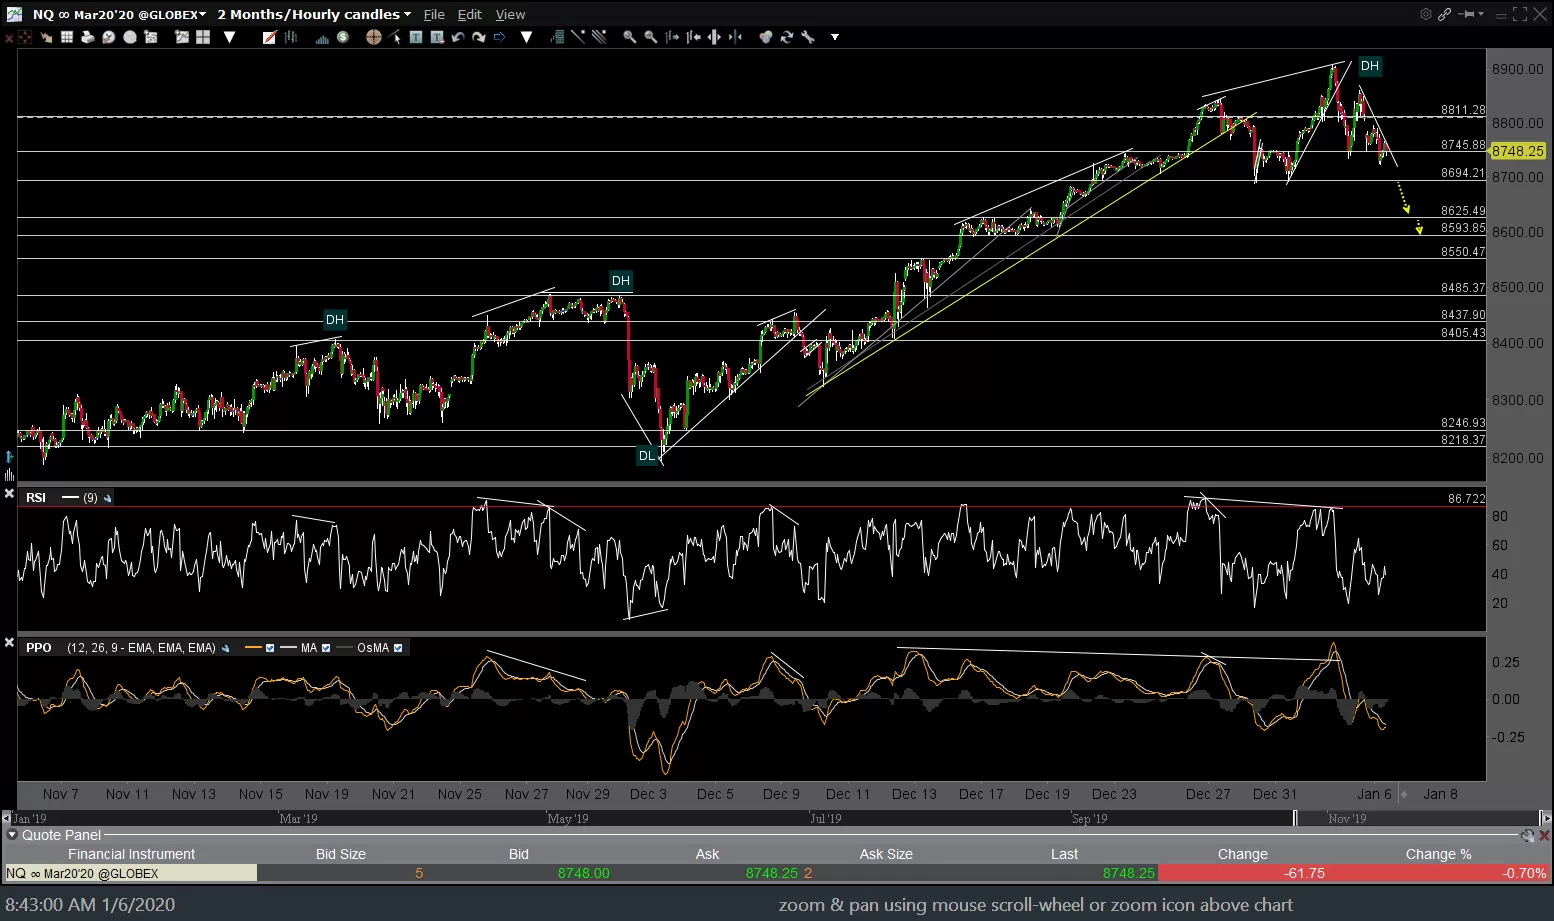
Some nearby support levels & targets are shown on the 60-minute charts of /NQ (Nasdaq 100 futures) and /ES (S&P 500) below as well.
-
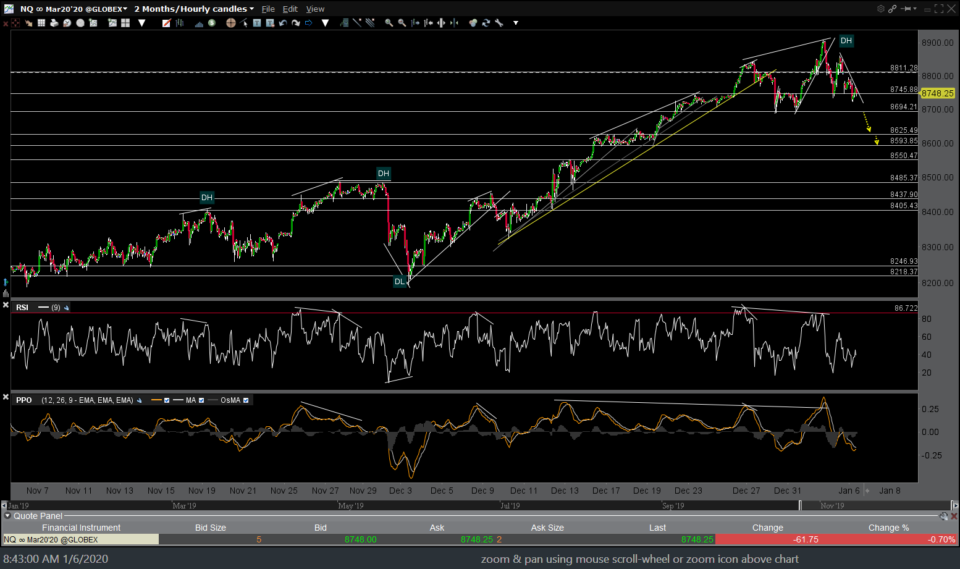
- NQ 60m Jan 6th
-
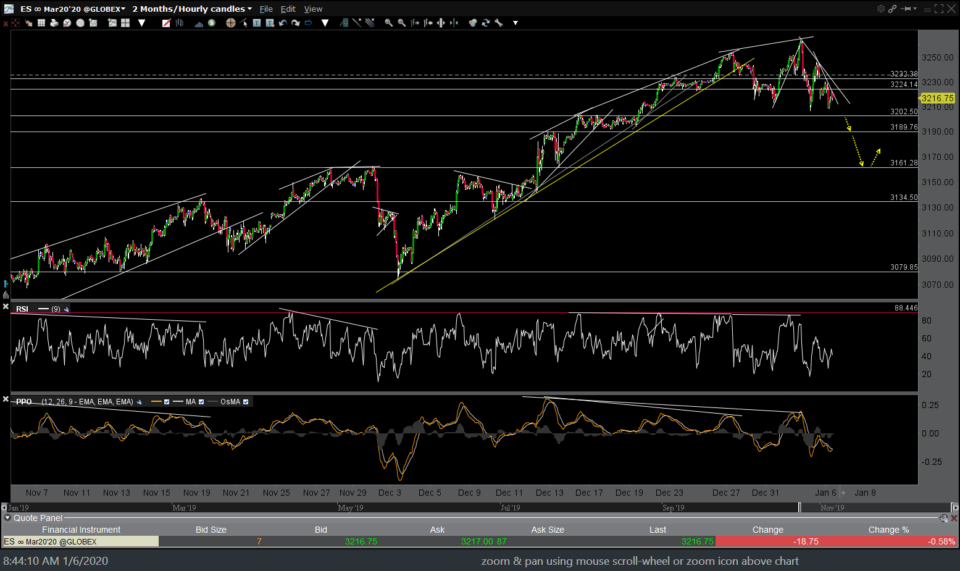
- ES 60m Jan 6th