
Here’s the updated SPY chart with the AAII bull/bear spread extremes. Yesterday’s survey results came in once again above the +18% extreme threshold for the fourth consecutive week. For those new to the site, I’ve discussed how these extreme bullish and bearish readings often precede significant corrections and rallies in the stock market. Those previous posts which discuss the methodology and include a long-term chart for a visual of the track record of this sentiment indicator can be found by clicking here and here.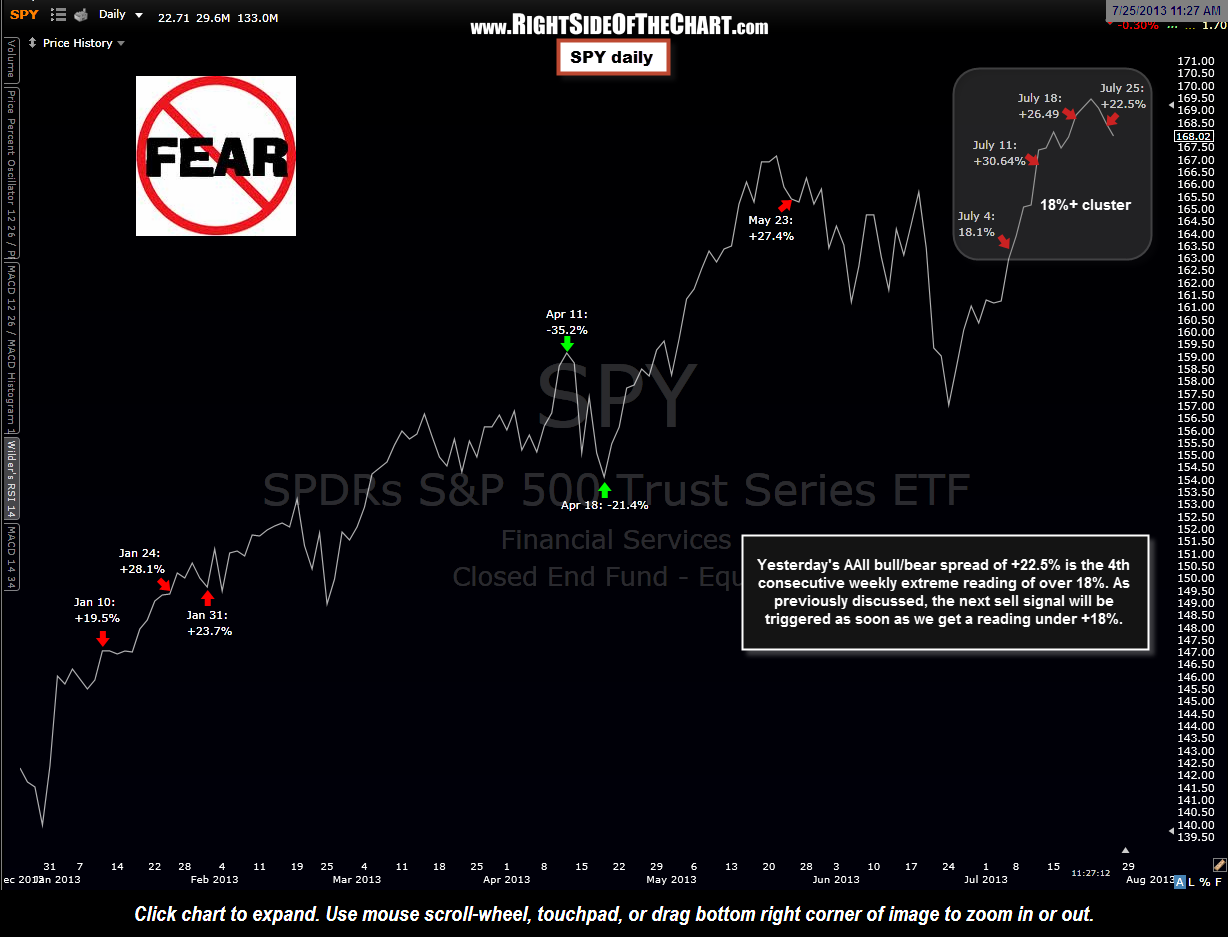
A few important things that I will continue to reiterate regarding this signal is that 1) It is not an exact timing indicator, although typically the trend reversals manifest within days to weeks of the signal. 2) When +/- 18% reading come in clusters, as they often do, the signal is not given until the extreme reading subside (a print back below +18% or above -18%). In a few rare instances over the last decade, these extreme readings have even been know to persist for months at a time. 3) No signal indicator is 100% effective, not even close. Therefore, like all indicators, the AAII extreme readings should be used in conjunction with other tools and analysis rather than as a stand-alone signal.
The basic premise behind using extreme sentiment readings as contrarian buy or sell signals is that when the vast majority of market participants are bullish (or bearish), then they are most likely already fully invested (or short/out of equities). Therefore, the supply/demand equation in the markets begins to flip as there is now a larger pool or potential sellers than buyers (or buyers vs. sellers).