
This chart took quite some time to put together so hopefully some traders & investors will find it useful and might understand why I have been very reluctant to add new long-side trade ideas despite the all the bullish rhetoric and price action since the start of the new year. I’ve often stated how I find the various sentiment surveys to be “noise” and only useful (and actually one of the most useful tools in trading IMO), when at rare extremes.
To take it a bit further, I don’t even care much about extreme bullish or extreme bearish readings by themselves but what does get my attention is when the bull to bear spread is at extremes, such as it currently is. The reason for this is that we could have a high number of bulls one week but that might not necessarily be accompanied by a very low reading of bears or vice versa. However, when the bull-bear spread on the IIAA weekly sentiment survey reaches the extreme readings of 18% or higher or -18% or lower, I find these to be some of the most reliable and timely buy or sell indicators out there. Of course, nothing has a 100% success rate in trading…not even close. With that being said, I’ll let the chart below do the talking.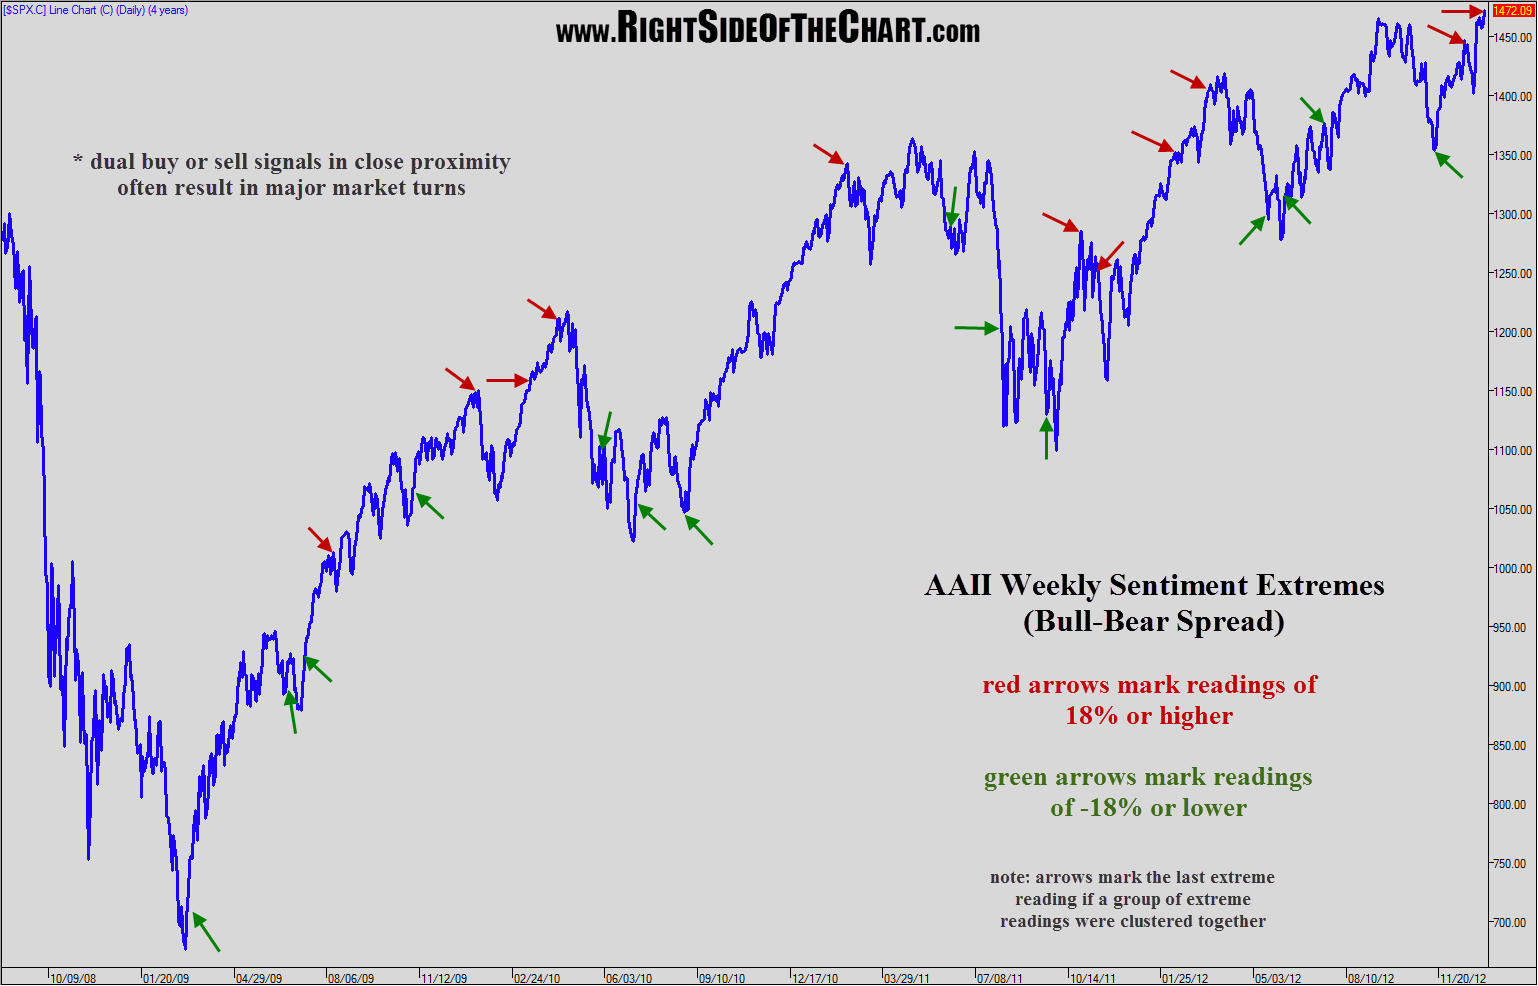 I started with the cluster of extreme bearish readings that marked the end of bear market in March 2009. Each green arrow marks the exact date (weekly reporting date) of bull-bear spreads of -18% or lower. Those reading come only when we have an unusually high percentage of bears vs. an unusually low percentage of bulls (i.e.- a contrarian buy signal). The red arrows marks weekly bull-bear spreads of 18% or higher, a contrarian sell signal from extreme bullishness. Note: When I come across a cluster of consecutive or nearly consecutive extreme readings, I place the arrow on the last extreme reading. Although every extreme reading did not mark a major inflection point in the market, every major inflection point WAS marked (+/-) by one of the readings and those that didn’t, typically marked at least a tradable counter-trend correction. I have included all the weekly data going back to Feb ’08 for anyone wanting to verify this data. Please let me know if you find any errors so that I may correct them.


