
On January 10th of this year, I posted one of the more reliable buy & sell signals that I follow. I would highly encourage those interested to revisit the notes from that post which can be viewed by clicking here. As luck (or lack thereof) would have it, the Jan 10th sell signal that was given the day of that post was only one of two of the 14 sell signals given since the bull market began back in March 2009 that did not pan out (not including the two current sell signal that just triggered which mark the 15th & 16th sell signals since the bull market began).
As I continually state: no stand-alone buy or sell indicator is perfect or even close to perfect. However, I continue to believe that these signals are amongst the most effective out there, especially considering their simplicity. As they are most useful in signaling intermediate-term trend changes, they should not be considered exact timing indicators. Also as stated in the previous post, these signals are often most effective and tend to precede the most powerful rallies and corrections when dual signals are triggered in relatively close proximity (within weeks apart).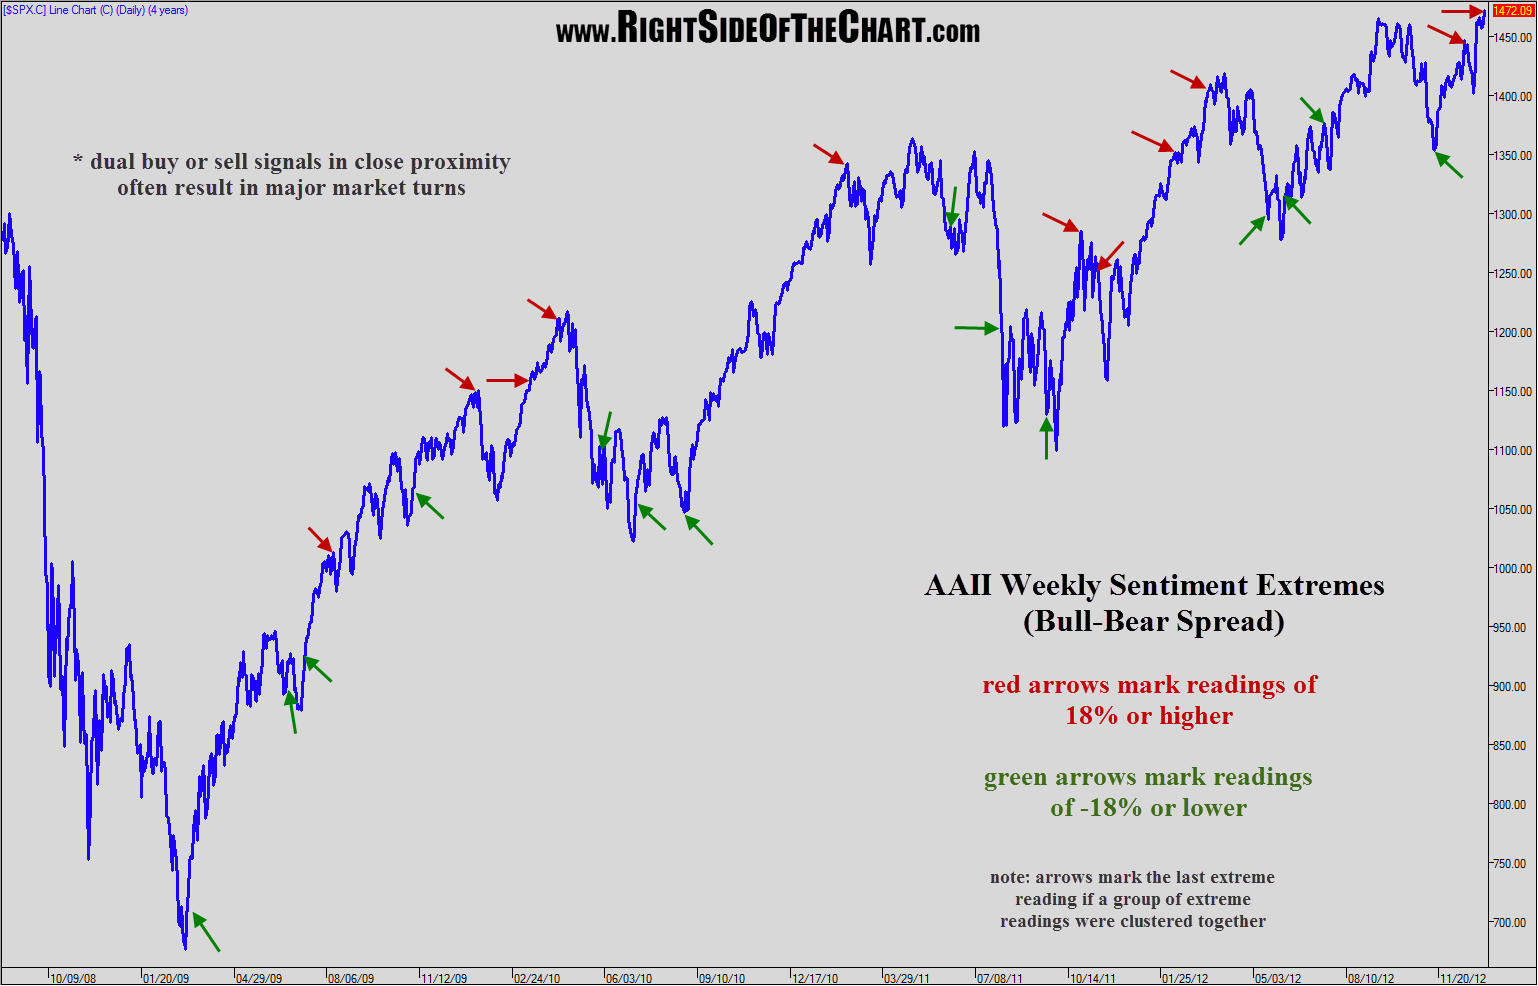 The first chart above is the same chart posted on Jan 10th. At the time, I had manually inserted all the arrows (a very time consuming process) using screen capture software as that particular chart did not include arrows on the drawing tools. As such, I am unable to simply update that same chart so I have updated a second chart covering all of 2013, beginning with that last sell signal from Jan 10th. As that chart below shows, shortly after that false sell signal on Jan 10th of this year, we did get a cluster of two weekly consecutive sell signals on Jan 24th & Jan 31. Those signals were followed by a market top less than three weeks later and a correction that took prices below the levels where both signals were triggered. That was the most mild correction to take place after a cluster of dual sell signals but a decent correction nonetheless.
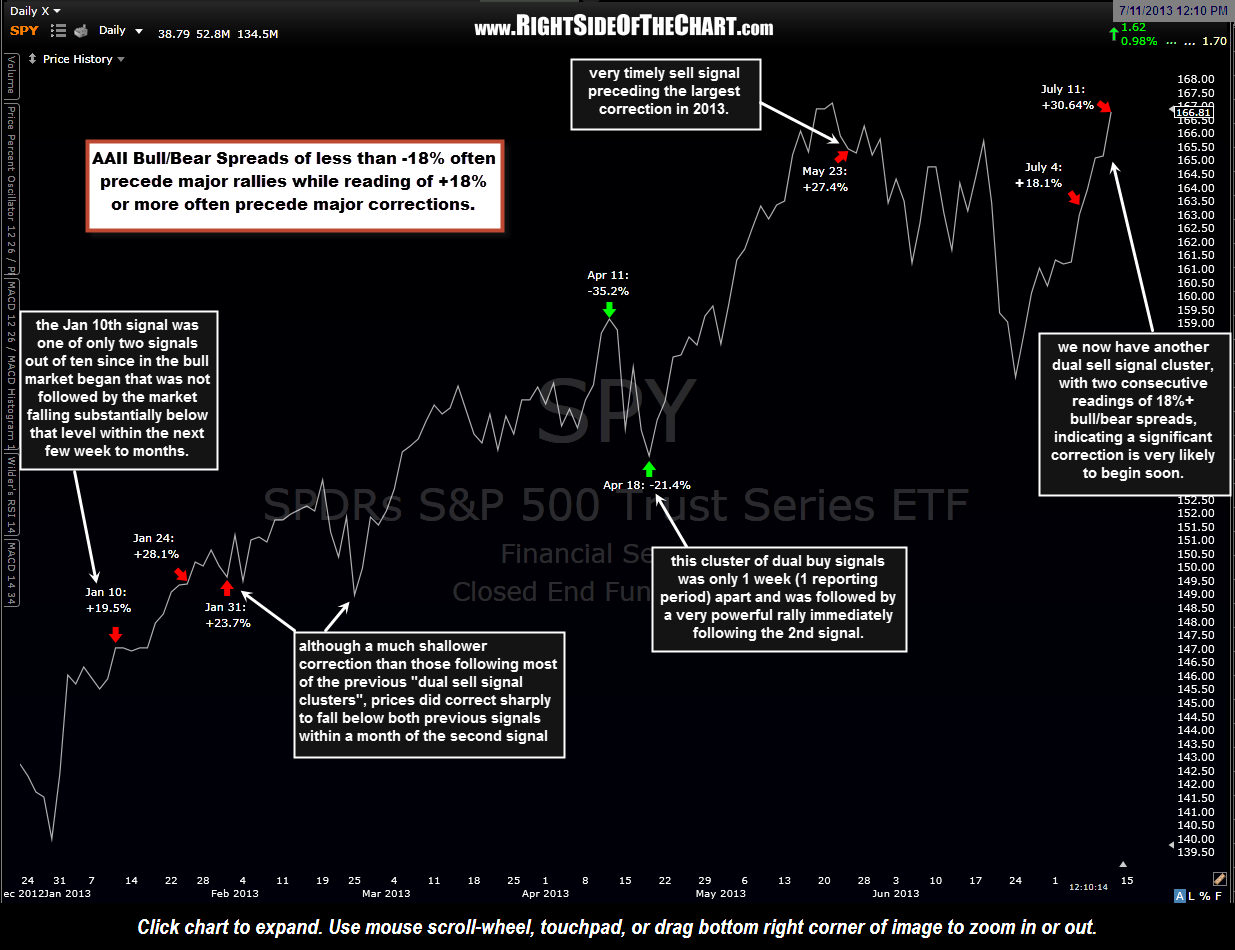 From there, the next + or – 18% bull/bear spread signal came on April 11th in the form of a buy signal (-18% or greater), followed by another consecutive -18% reading the following week, once again providing a high probability “cluster” signal. That second -18% reading on April 18th marked the exact bottom of a sharp correction and was immediately followed by the sharpest rally of 2013. The next signal came as a +18% sell signal on May 23rd, which was just shortly after the largest correction of the year began. That brings us to today as the latest AAII Sentiment Survey results have been released and have given a nearly off-the-charts bull/bear spread of +30.64%. This extreme bullish reading follows the last week’s sell signal of an +18.1% bull/bear spread, for yet another dual-weekly sell signal cluster.
Again, these are not exact timing indicators as although they can & often have played out immediately, they can also take several weeks before a trend reversal begins (if at all). Best to study that previous chart to get a feel for the effectiveness & timeliness of these signals. Also keep in mind that all buy & sell indicators, as with this one, are most effective when confirmed with or used in conjunction with other metrics and technical signals.